| Population by Age and Area | ||||
| Area | 0 - 15 years | 16 - 64 years | 65+ years | Total |
|---|---|---|---|---|
| Derby | 54,956 | 174,676 | 44,517 | 274,149 |
| Derbyshire | 137,322 | 499,035 | 186,020 | 822,377 |
| Amber Valley | 21,569 | 78,858 | 30,024 | 130,451 |
| Bolsover | 14,300 | 52,218 | 17,255 | 83,773 |
| Chesterfield | 17,604 | 64,755 | 23,686 | 106,045 |
| Derbyshire Dales | 10,111 | 40,615 | 21,031 | 71,757 |
| Erewash | 19,174 | 70,825 | 24,254 | 114,253 |
| High Peak | 14,973 | 55,690 | 21,296 | 91,959 |
| North East Derbyshire | 17,684 | 62,527 | 26,435 | 106,646 |
| South Derbyshire | 21,907 | 73,547 | 22,039 | 117,493 |
| Source: Mid-year estimates 2024 | ||||
Chesterfield
Locality
Chesterfield
Diabetes
Dementia
Smoking
Ageing Population
Demographics

 Introduction
Chesterfield is a historic market town and is the second largest settlement in Derbyshire, with Derby City being the largest. It is widely recognised for the Crooked Spire of the Parish Church of St Mary’s and All Saints, a prominent landmark that defines the towns skyline. Nestled between the Peak District and the Urban centres of Sheffield and Derby, Chesterfield serves as a key gateway to both industrial and rural landscapes. Its strategic location and rich heritage have shaped its identity across the centuries.
Formed in 1974 under the Local Government Act, the modern Borough of Chesterfield brought together the historic Municipal Borough of Chesterfield, the Staveley Urban District, and Brimington civil parish. The area’s legacy is deeply rooted in coal mining, engineering, and rail transport, with landmarks such as the Chesterfield Canal and Barrow Hill Roundhouse reflecting its industrial past. Today, Chesterfield blends tradition with regeneration, offering a vibrant mix of heritage, commerce, and community life.
In the Chesterfield area, there are two primary tiers of local government: Chesterfield Borough Council (the district council for the town) and Derbyshire County Council. Additionally, Chesterfield borough includes the two civil parish councils of Brimington Parish Council and Staveley Town Council. Chesterfield now also falls within the East Midlands Combined County Authority, the Mayor of which works with partners across the region and beyond to deliver transformational change for the East Midlands, with responsibility for transport, skills and adult education, housing and land, net-zero and economic development.
Chesterfield has a population of approximately 104,000, with the majority living in the urban centre of Chesterfield Town and the rest spread across surrounding communities such as Staveley, Brimington and other smaller settlements. The borough contains around 48,000 households, making it one of the more densely populated districts in Derbyshire. The 2021 Census also highlights Chesterfield’s ageing population, with a 19.5% increase in residents aged 64-74 over the past decade1. This demographic shift places additional pressure on health and care services, particularly in areas already facing socio-economic challenges. Geographically, it is situated 24 miles north of Derby and 11 miles south of Sheffield, at the confluence of the Rivers Rother and Hipper. The borough shares boundaries with North-East Derbyshire district to the north, west and south, and with Bolsover district to the east2.
Chesterfield Borough has a strong industrial heritage and benefits from excellent commuter links to major cities including Sheffield, Nottingham, Derby, Manchester, and Leeds, supported by its mainline railway station and proximity to the M1 motorway, which runs along the borough’s eastern boundary. To the north and west, the borough features extensive areas of open countryside, much of which lies within the North East Derbyshire Green Belt. The Rother Valley runs through the borough from south to north, encompassing long-established industrial zones, railway infrastructure, and the historic Chesterfield Canal. As the largest town in Derbyshire, Chesterfield serves as a key regional hub for commerce and public services. Chesterfield has multiple secondary schools and further education opportunities are provided locally by Chesterfield College.
Healthcare provision includes at least two Primary Care Networks (PCNs), including Arc Primary Care and Royal Primary Care Chesterfield, both of which fall broadly within the wider Chesterfield & Dronfield Primary Care Network. Arc Primary Care is a network of ten GP practices, while Royal Primary Care Chesterfield operates multiple sites, including The Grange Family Health Centre, Rectory Road Medical Centre, and Inkersall Family Health Centre, providing family medicine services across the area. Secondary care is delivered by Chesterfield Royal Hospital NHS Foundation Trust, which serves a population of over 400,000 and expanded its facilities in 2023 with the opening of a new £27 million Emergency Department. Mental Health services are delivered by Derbyshire Healthcare NHS Foundation Trust, with additional support from charities and community-based providers. Preventative and community health services are commissioned through Joined up Care Derbyshire, focusing on integrated, place-based care.
Despite its strengths, Chesterfield faces significant health challenges and ranks among the most deprived areas in England for health and disability. According to the English Indices of Deprivation (IMD) the borough’s ranking in this domain deteriorated from13th to 11th most deprived, placing it within the bottom 5% nationally. Chesterfield is ranked 78th out of 296 local authority districts, making it slightly less deprived overall when compared to 2019 (when it was 86th) but still within the most deprived third nationally and the second most deprived district in Derbyshire after Bolsover3.
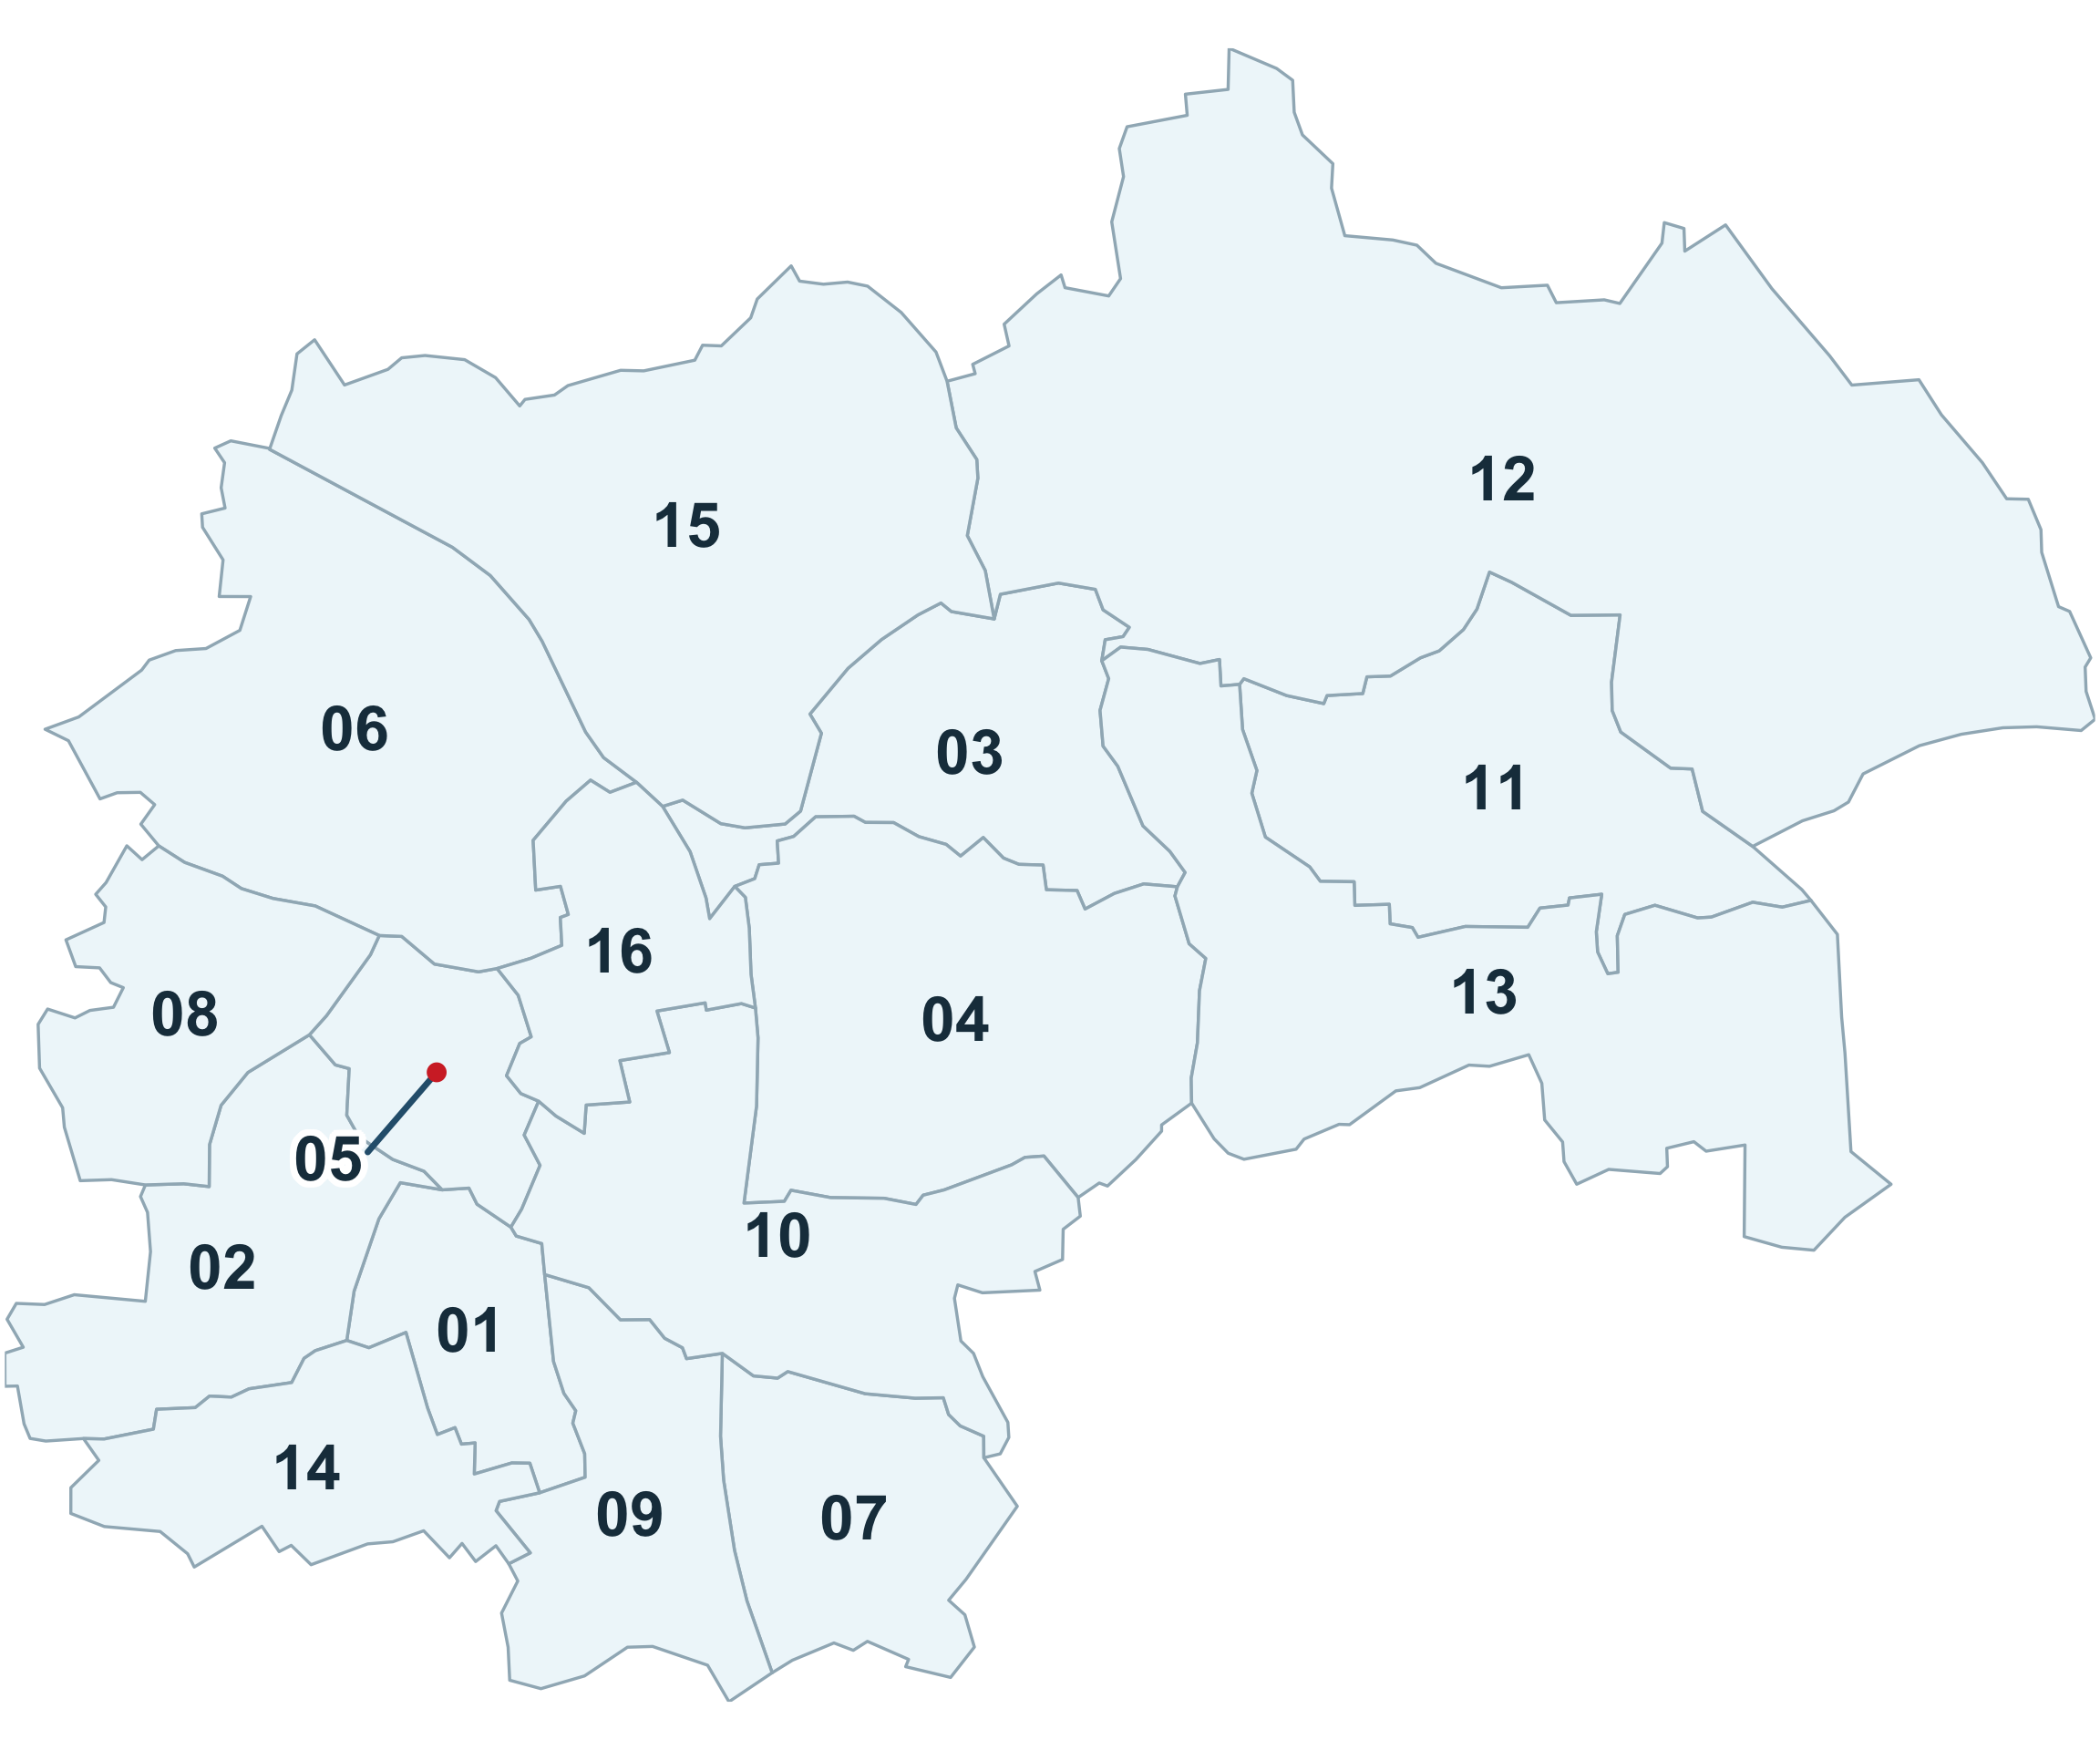
WARD REFERENCE
01: Brampton East & Boythorpe
02: Brampton West & Loundsley Green
03: Brimington North
04: Brimington South
05: Brockwell
06: Dunston
07: Hasland
08: Linacre
09: Rother
10: Spire
11: Staveley Central
12: Staveley North
13: Staveley South
14: Walton
15: Whittington
16: Whittington Moor
 Why is it important to Population Health?
Health inequalities refer to unfair and avoidable differences in health outcomes between groups or populations—such as variations in life expectancy or the age at which preventable diseases and conditions occur. These disparities are closely linked to the wider determinants of health: the social, economic, and environmental factors in which people are born, live, work and age. Factors such as housing, income, education, and access to amenities significantly influence lifestyle choices, overall wellbeing, and both the quality and length of life.
These determinants are particularly relevant in Chesterfield, where persistent deprivation and environmental challenges contribute to poorer health outcomes. The borough experiences higher levels of deprivation than national averages, with 54.8% of households deprived in at least one dimension, exceeding the England and Wales average of 50.9%4. When people lack access to essentials such as healthy food, warm homes, and affordable amenities, the resulting stress can weaken the immune system and contributing to preventable ill health and premature mortality.
While overall life expectancy in Chesterfield is broadly in line with national averages, significant disparities exist between communities. Residents in the most deprived areas—including parts of Staveley, Rother, and Barrow Hill—experience notably lower life expectancy and fewer years in good health compared to those in more affluent neighbourhoods such as Walton and West Brampton. According to 2021-2023 ONS data, healthy life expectancy is significantly lower than total life expectancy: 60.1 years for men and 61.8 years for women. In the most deprived areas, the gap between total and healthy life expectancy can be as wide as 20 years for men and 25 years for women5.
Food insecurity is evidenced through Chesterfield Foodbank’s voucher referral system, and environmental challenges persist- Central Chesterfield ranks as the third most polluted area in Derbyshire, and regular flooding from the Rivers Rother and Hipper affects central areas and retail parks.
According to data taken from the Public Health Outcomes Framework (May, 2025) and local intelligence, Chesterfield performs worse than both the England and Derbyshire averages on several key indicators;
Life expectancy and mortality
- Life Expectancy at Birth Life expectancy at 65
- Under 75 mortality rate – from causes considered preventable
- Under 75 mortality rate – from cancer
- Under 75 mortality rate – from liver disease
- Under 75 mortality rate – from liver disease considered preventable
Children and young people’s health
- Children in absolute low-income families
- Children in relative low-income families
- Under 18s conception rate
- Childhood obesity (Y6)
- Chlamydia detection rate (Females, 15 to 24 years)
- Youth unemployment
- Children in need
Adult Health and wellbeing
- Adult obesity
- Fuel Poverty
- Drug-related deaths
- Alcohol-related hospital admissions
- Prevalence of MSK problems
- Emergency hospital admissions for intentional self-harm (all ages)
- Higher depression and anxiety indicators in deprived areas
- Emergency readmission within 30 days of hospital discharge
- High numbers of unpaid carers
- Smoking status at time of delivery
Environmental and social factors
- Food insecurity and foodbank usage
- Air pollution
- Violent crime- hospital admissions for violence (including sexual violence)
These indicators have helped shape the Chesterfield Health and Wellbeing Partnership’s priority areas for action. By focusing efforts at a locality level, partners aim to target resources, maximise reach, and reduce health inequalities, ultimately improving population health and wellbeing across the borough.
 The Derbyshire Population Health Approach
The Derbyshire Population Health Approach focuses on prevention, population health, evidence-informed practices, causes, and collaboration. It emphasises proactive measures to prevent health issues, tailors interventions to specific populations, incorporates evidence-informed practices, addresses underlying causes, and promotes collaboration for effective action.
When considering Chesterfield within The Derbyshire Population Health Approach:
• Prevention
The Derbyshire Population Health Approach focuses on prevention, population health, evidence-informed practices, causes, and collaboration. It emphasises proactive measures to prevent health issues, tailor’s interventions to specific populations, incorporates evidence-informed practices, addresses underlying causes, and promotes collaboration for effective action.
The Chesterfield Health and Wellbeing Partnership Board, established in 2015, exists to provide a strategic platform to support local partners in working together to improve the health and wellbeing of our local populations and to reduce inequalities through place-based and community partnership approaches.
The Partnership’s vision is to strive to create the conditions for individuals, families and communities to live happy, healthy and fulfilling lives; working collaboratively with communities to focus activities on prevention and strengthening the building blocks of good health to improve the health and wellbeing of communities across Chesterfield.
The Chesterfield Partnership have agreed to adopt the Derbyshire Health and Wellbeing board priorities which are:
- Tackle the 4 main risk factors that lead to poor health (Smoking, alcohol use, poor diet and physical inactivity are all key risk factors which lead to preventable ill health and premature mortality).
- Support good mental health.
- Support communities to be resilient and independent.
- Tackle child poverty and enable children and young people in Derbyshire to start well
- Develop the Chesterfield Health and Wellbeing Partnership to deliver on the areas of focus
Over recent years, the Chesterfield Health and Wellbeing Partnership has facilitated and devolved funding to series of sub-groups referred to as networks. These networks sit beneath the Partnership Board and report into it, supporting the delivery of local health and wellbeing priorities. Our approach to working is led by these 4 geographical community networks, 3 topic-based networks and 2 further network groups:
Geographical networks:
- North - includes the areas of Dunston, Whittington Moor, Old & New Whittington
- South - includes the areas of Rother, St Augustine’s, Boythorpe, Grangewood & Hasland
- Staveley Area - includes the areas of Barrow Hill, Duckmanton, Hollingwood, Inkersall, Poolsbrook, Mastin Moor and Staveley central
- Loundsley Green & Holme Hall
Topic based networks:
- Financial Inclusion Group (FIG)
- Mental Health network
- Healthy Communities network
Two further groups:
- Community networks and insight group
- Collaboration and Learning Lab
Each network has identified its priorities across the five key areas of focus, tailoring actions to local needs. Co-production, people, social capital, and social connectedness are central to this work. Each network is responsible for designing its own action plan, supported by devolved funding to meet identified needs. In addition to the geographical networks, the topic-based networks such as the FIG, Mental Health network, and Healthy Communities network target specific areas of need.
The Collaboration and Learning Lab has been created to support the development of place-based approaches to tackling health inequalities. It also fosters a culture of collaborative learning and innovation, offering an informal space to test new ideas and approaches.
Working alongside partners to deliver a range of targeted programmes across Chesterfield, current work includes:
Barrow Hill Prevention Pilot
This initiative is an integrated place-based approach to prevention based in Barrow Hill Memorial Hall. The project is led by Barrow Hill Community trust with support from a range of system partners including Active Partners Trust, Chesterfield Borough Council, NHS Derby & Derbyshire Integrated Care Board (ICB) Royal Primary Care Trust, Public Health the Chesterfield Health and Wellbeing Partnership and VCSE partners.
Thrive and Blend
Thrive provides social prescribing support for young people aged 14–18 and young adults aged 19–25 recognising that vulnerability and the need for preventative, non‑clinical support often extend into early adulthood and across the transition to adulthood.
Through person‑centred, non‑clinical support, Thrive helps young people identify strengths and goals and supports access to community‑based activities and education that promote social participation, confidence and wellbeing. This contributes to early intervention, prevention and reduced escalation of need.
Blend Detached Youth Work
Blend delivers detached youth work in areas of high economic and social deprivation.
Blend supports early identification of need and improves access to community‑based activities and wider support, contributing to prevention, reduced inequalities and improved wellbeing outcomes for young people experiencing disadvantage.
Together, Thrive and Blend form part of a place‑based prevention system, supporting access between services and improving engagement by offering non‑clinical support for young people at increased risk of poorer outcomes.
Members of the Chesterfield Financial Inclusion Group worked in partnership with the Independent Food Aid Network (IFAN) to co‑produce the Chesterfield: Worrying About Money? resource. This provides a clear, step‑by‑step guide identifying which local agencies are best placed to support people experiencing financial difficulties.
In addition, IFAN has supported the delivery of a training session for local partners to improve understanding and use of the resource, strengthening early identification of financial difficulty and more consistent signposting across services. To increase reach, the resource will be included in Council Tax bills for 2026–27.
Together, these actions support a joined‑up, preventative approach to financial inclusion by improving awareness of support, strengthening workforce capability, and reaching residents at key points of financial stress. This contributes to early help, reduced escalation of financial difficulty, and mitigation of associated health inequalities.
Feeling Connected – Strengthening Social Connection
Feeling Connected, delivered by Derbyshire Voluntary Action, supports and nurtures community organisers to develop and deliver initiatives that strengthen social connection and participation across Chesterfield.
The programme focuses on building community capacity by supporting grassroots and resident‑led activity, enabling local people to create inclusive opportunities within their neighbourhoods. By strengthening participation, confidence and community capability, Feeling Connected contributes to improved wellbeing and helps to reduce inequalities associated with social isolation and exclusion.
• Population
Within the borough, 8 of its 69 Lower Super Output Areas (LSOAS) fall within the 10% most deprived areas in England. These LSOAs are:
- Grangewood Birdholme
- Loundsley Green Holme Hall
- St Augustines
- Middlecroft
- Barrowhill and New Whittington
- Old Whittington
- Mastin Moor
- Staveley Poolsbrook
A further 9 LSOAs fall within the 20% most deprived nationally. Notably, Grangewood Birdholme in Rother is the third most deprived neighbourhood in Derbyshire and falls within the 2% most deprived areas in England. These figures highlight significant localised inequalities and areas in need of targeted support. Youth unemployment stands at 5.7%, the highest in the County and above the national average of 4.5%6.
There is strong community infrastructure across the area with key organisations providing provision where residents meet for companionship and support. However, transport barriers affect access to services, particularly for older residents. The Chesterfield and North East Derbyshire Volunteer Centre provides VOLIFE platform for volunteering opportunities.
• Evidence
Local health data from ONS Health Index and census analysis provides evidence-based insights into health patterns across Chesterfield’s LSOAs, informing targeted interventions for the most deprived areas. Community insight and data from the JSNA is used by partners to shape future spend and projects commissioned.
The partnership utilises community engagement approaches to gather evidence for public health initiatives, working through trusted community organisations and spaces to better understand barriers to health and wellbeing services.
The theme of ‘Understanding Communities’ first introduced in the 2019-2021 strategy has become even more prominent in recent years. A new Community networks and insight group is being established to help build resilient communities and community spaces. It will also provide a forum to agree how community voice and lived experience can be embedded across the networks and the wider Chesterfield Local Partnerships to drive meaningful change.
• Causes
There are many interconnected factors that influence peoples physical and mental health and wellbeing and contribute to poor health outcomes. These include social and economic circumstances, the physical environment, individual lifestyle behaviours, and access to amenities and health care. Collectively, these are often referred to as the ‘causes of the causes’ -the wider or social determinants of health.
Understanding and addressing these determinants is central to population level approaches that support people to live healthier lives. Health Inequalities arise from a complex range of causes, and placing decision making and funding in the hands of local communities is key to tackling them effectively. In Chesterfield, devolving resources to the four geographical networks and three topic focused networks ensures that communities are actively involved in identifying and addressing the issues that matter most to them.
This community insight enables the Chesterfield Health and Wellbeing Partnership to respond to locally identified priorities which contribute to the root causes of poor health. Common issues raised by residents include social isolation, digital and financial exclusion, transport barriers to accessing services, poor mental health, concerns around anti-social behaviour, and a high number of people living with long-term conditions and disabilities.
• Collaboration
At a locality level, the aim is to address health inequalities and promote equitable outcomes for the Chesterfield population by working in partnership with stakeholders, sectors and communities. The overarching ambition of Chesterfield’s local partnerships is to support the borough to remain a great place to live, work, visit and invest through joined up approaches.
A strong focus across these partnerships is placed on tackling inequalities and fostering inclusive growth by building healthy, safe and resilient communities. Effective multi agency collaboration is essential to achieving improvements. By identifying shared priorities that align with partners plans and strategies, joint working encourages ownership and strengthens delivery.
To support this, a statement of intent was developed to capture the culture of collaboration and set the ambition for a community-led approach. Two key success factors underpin this vision:
- Harnessing the strengths of local communities through active engagement
- Building strong relationships and a shared culture, guided by partnership principles.
To translate this intent into action, organisations and partnerships are encouraged to commit to the following approaches:
- Working for Chesterfield as a Place and adopting the partnership principles.
- Supporting community connectors and ambassadors as key links to residents.
- Strengthening and broadening community spaces as part of a self-sustaining support ecosystem.
- Delivering integrated prevention initiatives and services.
- Strengthening the building blocks of good health.
- Developing effective support systems that help people when they need it and prevent health inequalities.
Given the current economic climate and limited resources, it is vital that partnership efforts are well-coordinated to maximise impact, reduce duplication and make best use of available assets.
The Chesterfield Health and Wellbeing Partnership works alongside the NHS Place Alliance and integrates within the broader Chesterfield Local Partnerships system framework. This includes coordination with the Community Safety Partnership, Skills and Employment Board, and Destination Chesterfield.
 Latest Derbyshire Data
| Population in each IMD Decile by Area (count) | |||||||||||
| Area | 1 - Most deprived | 2 | 3 | 4 | 5 | 6 | 7 | 8 | 9 | 10 - Least deprived | Total |
|---|---|---|---|---|---|---|---|---|---|---|---|
| Derby | 57301 | 45294 | 24928 | 17295 | 22316 | 20465 | 7866 | 17904 | 18804 | 31447 | 263620 |
| Derbyshire | 42201 | 71195 | 80125 | 92050 | 91080 | 70384 | 105556 | 94952 | 84076 | 71836 | 803455 |
| Amber Valley | 5043 | 12740 | 5635 | 17589 | 21197 | 6329 | 15897 | 19090 | 12087 | 11327 | 126934 |
| Bolsover | 4726 | 14880 | 7410 | 21103 | 13929 | 4155 | 7774 | 5976 | 1588 | 0 | 81541 |
| Chesterfield | 12280 | 13362 | 24337 | 12221 | 2668 | 10375 | 10834 | 3027 | 5199 | 9801 | 104104 |
| Derbyshire Dales | 1533 | 0 | 0 | 4696 | 6772 | 14226 | 16350 | 16920 | 10207 | 1051 | 71755 |
| Erewash | 8990 | 12594 | 13767 | 6482 | 11797 | 9358 | 12235 | 12184 | 17110 | 8556 | 113073 |
| High Peak | 4162 | 4226 | 7878 | 7024 | 12903 | 10094 | 15338 | 17539 | 1233 | 10709 | 91106 |
| North East Derbyshire | 3968 | 9515 | 13444 | 10459 | 11240 | 10690 | 11304 | 5780 | 11672 | 15725 | 103797 |
| South Derbyshire | 1499 | 3878 | 7654 | 12476 | 10574 | 5157 | 15824 | 14436 | 24980 | 14667 | 111145 |
| Source: Ministry of Housing, Communities and Local Government IMD 2025, ONS LSOA mid-year population estimates 2022 | |||||||||||
| Population in each IMD Decile by Area (percentage) | |||||||||||
| Area | 1 - Most deprived | 2 | 3 | 4 | 5 | 6 | 7 | 8 | 9 | 10 - Least deprived | Total |
|---|---|---|---|---|---|---|---|---|---|---|---|
| Derby | 21.7% | 17.2% | 9.5% | 6.6% | 8.5% | 7.8% | 3% | 6.8% | 7.1% | 11.9% | 263620 |
| Derbyshire | 5.3% | 8.9% | 10% | 11.5% | 11.3% | 8.8% | 13.1% | 11.8% | 10.5% | 8.9% | 803455 |
| Amber Valley | 4% | 10% | 4.4% | 13.9% | 16.7% | 5% | 12.5% | 15% | 9.5% | 8.9% | 126934 |
| Bolsover | 5.8% | 18.2% | 9.1% | 25.9% | 17.1% | 5.1% | 9.5% | 7.3% | 1.9% | 0 | 81541 |
| Chesterfield | 11.8% | 12.8% | 23.4% | 11.7% | 2.6% | 10% | 10.4% | 2.9% | 5% | 9.4% | 104104 |
| Derbyshire Dales | 2.1% | 0 | 0 | 6.5% | 9.4% | 19.8% | 22.8% | 23.6% | 14.2% | 1.5% | 71755 |
| Erewash | 8% | 11.1% | 12.2% | 5.7% | 10.4% | 8.3% | 10.8% | 10.8% | 15.1% | 7.6% | 113073 |
| High Peak | 4.6% | 4.6% | 8.6% | 7.7% | 14.2% | 11.1% | 16.8% | 19.3% | 1.4% | 11.8% | 91106 |
| North East Derbyshire | 3.8% | 9.2% | 13% | 10.1% | 10.8% | 10.3% | 10.9% | 5.6% | 11.2% | 15.1% | 103797 |
| South Derbyshire | 1.3% | 3.5% | 6.9% | 11.2% | 9.5% | 4.6% | 14.2% | 13% | 22.5% | 13.2% | 111145 |
| Source: Ministry of Housing, Communities and Local Government IMD 2025, ONS LSOA mid-year population estimates 2022 | |||||||||||
| Population by Ethnicity (percentage) | |||||
| Area | Asian, Asian British or Asian Welsh | Black, Black British, Black Welsh, Caribbean or African | Mixed or Multiple ethnic groups | White | Other ethnic group |
|---|---|---|---|---|---|
| England | 9.6 | 4.2 | 3.0 | 81.0 | 2.2 |
| Derby | 15.6 | 4.0 | 3.7 | 73.8 | 2.9 |
| Derbyshire | 1.5 | 0.5 | 1.4 | 96.3 | 0.3 |
| Amber Valley | 1.0 | 0.3 | 1.2 | 97.3 | 0.2 |
| Bolsover | 0.9 | 0.5 | 0.9 | 97.4 | 0.3 |
| Chesterfield | 1.9 | 0.8 | 1.4 | 95.5 | 0.4 |
| Derbyshire Dales | 0.7 | 0.2 | 1.0 | 97.8 | 0.3 |
| Erewash | 1.6 | 0.8 | 1.8 | 95.4 | 0.4 |
| High Peak | 0.8 | 0.2 | 1.3 | 97.4 | 0.2 |
| North East Derbyshire | 0.9 | 0.3 | 1.1 | 97.4 | 0.2 |
| South Derbyshire | 3.6 | 0.8 | 1.8 | 93.1 | 0.7 |
| Source: Census 2021 | |||||
Trend Data
The following charts show life expectancy over time in Derbyshire by district and sex (compared to England)
PHOF Profile
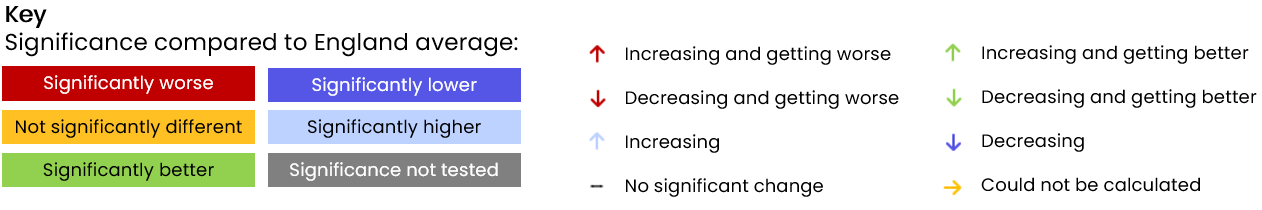
Notes:
- For indicators that aren’t straightforward to determine whether a high value is good or bad are shaded in blue rather than red/amber/green.
- Recent trend refers to analysis done by Fingertips which tests for a statistical trend. Please see the Fingertips tool for full details.
- Increases and decreases are only shown if they are statistically significant.
| A. Overarching indicators | ||||||||
| Indicator | Age | Sex | Period | Value | East Midlands region | England | Unit | Recent Trend |
|---|---|---|---|---|---|---|---|---|
| A01b - Life expectancy at 65 | 65 | Female | 2024 | 20.5 | 21.3 | 21.6 | Years | |
| A01b - Life expectancy at 65 | 65 | Female | 2022 - 24 | 20.4 | 21.0 | 21.4 | Years | |
| A01b - Life expectancy at 65 | 65 | Male | 2024 | 17.7 | 18.9 | 19.2 | Years | |
| A01b - Life expectancy at 65 | 65 | Male | 2022 - 24 | 18.0 | 18.7 | 18.9 | Years | |
| A01b - Life expectancy at birth | All ages | Female | 2024 | 81.6 | 83.1 | 83.6 | Years | |
| A01b - Life expectancy at birth | All ages | Female | 2022 - 24 | 81.6 | 82.8 | 83.3 | Years | |
| A01b - Life expectancy at birth | All ages | Male | 2024 | 77.1 | 79.3 | 79.8 | Years | |
| A01b - Life expectancy at birth | All ages | Male | 2022 - 24 | 77.6 | 79.0 | 79.5 | Years | |
| A02a - Inequality in life expectancy at 65 | 65 | Female | 2021 - 23 | 3.5 | 4.8 | 5.0 | Years | |
| A02a - Inequality in life expectancy at 65 | 65 | Male | 2021 - 23 | 6.2 | 5.3 | 5.6 | Years | |
| A02a - Inequality in life expectancy at birth | All ages | Female | 2021 - 23 | 8.1 | 7.9 | 8.3 | Years | |
| A02a - Inequality in life expectancy at birth | All ages | Male | 2021 - 23 | 12.4 | 10.1 | 10.5 | Years | |
| Source: OHID Fingertips | ||||||||
| B. Wider Determinants of Health | ||||||||
| Indicator | Age | Sex | Period | Value | East Midlands region | England | Unit | Recent Trend |
|---|---|---|---|---|---|---|---|---|
| 1.01i - Children in low income families (all dependent children under 20) | 0-19 yrs | Persons | 2016 | 19.3 | 16.3 | 17.0 | % | |
| B01b - Children in absolute low income families (under 16s) | <16 yrs | Persons | 2023/24 | 22.0 | 20.7 | 19.1 | % | |
| B01b - Children in relative low income families (under 16s) | <16 yrs | Persons | 2023/24 | 25.6 | 24.1 | 22.1 | % | |
| B03 - Pupil absence | 5-15 yrs | Persons | 2023/24 | 7.3 | 7.1 | 7.1 | % | |
| B08d - Percentage of people in employment | 16-64 yrs | Persons | 2024/25 | 83.4 | 74.9 | 75.7 | % | |
| B09a - Sickness absence: the percentage of employees who had at least one day off in the previous week | 16+ yrs | Persons | 2021 - 23 | 4.2 | 2.1 | 2.2 | % | |
| B09b - Sickness absence: the percentage of working days lost due to sickness absence | 16+ yrs | Persons | 2021 - 23 | 3.7 | 1.3 | 1.2 | % | |
| B12a - Violent crime - hospital admissions for violence (including sexual violence) | All ages | Persons | 2021/22 - 23/24 | 35.9 | 28.8 | 34.2 | per 100,000 | |
| B12b - Violent crime - violence offences per 1,000 population | All ages | Persons | 2024/25 | 42.4 | 29.7 | 31.4 | per 1,000 | |
| B12c - Violent crime - sexual offences per 1,000 population | All ages | Persons | 2024/25 | 4.2 | 3.2 | 3.1 | per 1,000 | |
| B13a - Reoffending levels: percentage of offenders who reoffend | All ages | Persons | 2022/23 | 25.7 | 27.6 | 26.2 | % | |
| B13b - Reoffending levels: average number of reoffences per reoffender | All ages | Persons | 2022/23 | 3.4 | 4.2 | 4.0 | per re-offender | |
| B14a - The rate of complaints about noise | All ages | Persons | 2023/24 | 4.1 | 5.3 | 5.9 | per 1,000 | |
| B14b - The percentage of the population exposed to road, rail and air transport noise of 65dB(A) or more, during the daytime | All ages | Persons | 2021 | 3.2 | 3.0 | 4.3 | % | |
| B14c - The percentage of the population exposed to road, rail and air transport noise of 55 dB(A) or more during the night-time | All ages | Persons | 2021 | 6.5 | 6.2 | 8.4 | % | |
| B15a - Homelessness: households owed a duty under the Homelessness Reduction Act | Not applicable | Not applicable | 2024/25 | 11.6 | 11.6 | 13.6 | per 1,000 | |
| B15c - Homelessness: households in temporary accommodation | Not applicable | Not applicable | 2024/25 | 0.6 | 2.0 | 5.2 | per 1,000 | |
| B17 - Fuel poverty (low income, low energy efficiency methodology) | Not applicable | Not applicable | 2023 | 12.7 | 11.7 | 11.4 | % | |
| Source: OHID Fingertips | ||||||||
| C. Health Improvement | ||||||||
| Indicator | Age | Sex | Period | Value | East Midlands region | England | Unit | Recent Trend |
|---|---|---|---|---|---|---|---|---|
| C01 - Total prescribed LARC excluding injections rate / 1,000 | All ages | Female | 2024 | 61.7 | 41.6 | 40.0 | per 1,000 | |
| C04 - Low birth weight of term babies | >=37 weeks gestational age at birth | Persons | 2024 | 2.5 | 2.8 | 3.0 | % | |
| C06 - Smoking status at time of delivery | All ages | Female | 2024/25 | 8.0 | 7.9 | 6.1 | % | |
| C09a - Reception prevalence of overweight (including obesity) | 4-5 yrs | Persons | 2024/25 | 25.1 | 23.7 | 23.5 | % | |
| C09b - Year 6 prevalence of overweight (including obesity) | 10-11 yrs | Persons | 2024/25 | 36.9 | 36.3 | 36.2 | % | |
| C10 - Percentage of physically active children and young people | 5-16 yrs | Persons | 2024/25 | 41.9 | 48.9 | 49.1 | % | |
| C11a - Hospital admissions caused by unintentional and deliberate injuries in children (aged 0 to 14 years) | <15 yrs | Persons | 2023/24 | 70.6 | 54.9 | 72.7 | per 10,000 | |
| C11a - Hospital admissions caused by unintentional and deliberate injuries in children (aged 0 to 4 years) | 0-4 yrs | Persons | 2023/24 | 102.2 | 68.3 | 93.2 | per 10,000 | |
| C11b - Hospital admissions caused by unintentional and deliberate injuries in young people (aged 15 to 24 years) | 15-24 yrs | Persons | 2023/24 | 96.8 | 79.2 | 88.6 | per 10,000 | |
| C14b - Emergency Hospital Admissions for Intentional Self-Harm | All ages | Persons | 2023/24 | 211.0 | 128.1 | 117.0 | per 100,000 | |
| C15 - Percentage of adults meeting the '5-a-day' fruit and vegetable consumption recommendations (new method) | 16+ yrs | Persons | 2023/24 | 31.7 | 30.1 | 31.3 | % | |
| C15 - Proportion of the population meeting the recommended '5 a day' on a 'usual day' (adults) (old method) | 16+ yrs | Persons | 2019/20 | 56.2 | 55.0 | 55.4 | % | |
| C16 - Overweight (including obesity) prevalence in adults, (using adjusted self-reported height and weight) | 18+ yrs | Persons | 2023/24 | 72.1 | 67.1 | 64.5 | % | |
| C17a - Percentage of physically active adults | 19+ yrs | Persons | 2023/24 | 64.5 | 66.7 | 67.4 | % | |
| C17b - Percentage of physically inactive adults | 19+ yrs | Persons | 2023/24 | 26.0 | 22.7 | 22.0 | % | |
| C18 - Smoking Prevalence in adults (aged 18 and over) - current smokers (APS) | 18+ yrs | Persons | 2024 | 10.5 | 10.4 | 10.4 | % | |
| C18 - Smoking Prevalence in adults (aged 18 and over) - current smokers (APS) | 18+ yrs | Persons | 2022 - 24 | 11.9 | 11.6 | 10.9 | % | |
| C19d - Deaths from drug misuse | All ages | Persons | 2022 - 24 | 15.4 | 5.9 | 5.8 | per 100,000 | |
| C21 - Admission episodes for alcohol-related conditions (Narrow) | All ages | Female | 2023/24 | 565.3 | 396.8 | 339.5 | per 100,000 | |
| C21 - Admission episodes for alcohol-related conditions (Narrow) | All ages | Male | 2023/24 | 720.6 | 724.9 | 686.5 | per 100,000 | |
| C21 - Admission episodes for alcohol-related conditions (Narrow) | All ages | Persons | 2023/24 | 638.0 | 553.6 | 504.1 | per 100,000 | |
| C22 - Estimated diabetes diagnosis rate | 17+ yrs | Persons | 2018 | 88.6 | 84.6 | 78.0 | % | |
| C23 - Percentage of cancers diagnosed at stages 1 and 2 | All ages | Persons | 2022 | 56.9 | 55.2 | 56.8 | % | |
| C24a - Cancer screening coverage: breast cancer | 53-70 yrs | Female | 2025 | 77.8 | 71.9 | 71.7 | % | |
| C24b - Cancer screening coverage: cervical cancer (aged 25 to 49 years old) | 25-49 yrs | Female | 2024 | 73.5 | 68.2 | 66.1 | % | |
| C24c - Cancer screening coverage: cervical cancer (aged 50 to 64 years old) | 50-64 yrs | Female | 2024 | 77.3 | 75.8 | 74.3 | % | |
| C24d - Cancer screening coverage: bowel cancer | 60-74 yrs | Persons | 2025 | 73.9 | 74.2 | 72.9 | % | |
| C24e - Abdominal Aortic Aneurysm Screening Coverage | 65 | Male | 2024/25 | 85.7 | 86.3 | 82.2 | % | |
| C27 - Percentage reporting a long-term Musculoskeletal (MSK) problem | 16+ yrs | Persons | 2023 | 23.2 | 20.0 | 18.4 | % | |
| C28a - Self reported wellbeing: people with a low satisfaction score | 16+ yrs | Persons | 2022/23 | 10.4 | 6.5 | 5.6 | % | |
| C28b - Self reported wellbeing: people with a low worthwhile score | 16+ yrs | Persons | 2022/23 | 9.7 | 4.4 | 4.4 | % | |
| C28c - Self reported wellbeing: people with a low happiness score | 16+ yrs | Persons | 2022/23 | 9.4 | 9.3 | 8.8 | % | |
| C28d - Self reported wellbeing: people with a high anxiety score | 16+ yrs | Persons | 2022/23 | 20.7 | 21.5 | 23.3 | % | |
| C29 - Emergency hospital admissions due to falls in people aged 65 and over | 65+ yrs | Persons | 2023/24 | 1,591.7 | 1,908.5 | 1,984.0 | per 100,000 | |
| C29 - Emergency hospital admissions due to falls in people aged 65 to 79 | 65-79 yrs | Persons | 2023/24 | 837.5 | 908.4 | 954.7 | per 100,000 | |
| C29 - Emergency hospital admissions due to falls in people aged 80 plus | 80+ yrs | Persons | 2023/24 | 3,779.1 | 4,808.6 | 4,968.9 | per 100,000 | |
| Source: OHID Fingertips | ||||||||
| D. Health Protection | ||||||||
| Indicator | Age | Sex | Period | Value | East Midlands region | England | Unit | Recent Trend |
|---|---|---|---|---|---|---|---|---|
| D01 - Air pollution: estimated fraction of mortality attributable to particulate air pollution | 30+ yrs | Persons | 2024 | 5.3 | 5.4 | 5.3 | % | |
| D02a - Chlamydia detection rate per 100,000 aged 15 to 24 years | 15-24 yrs | Female | 2024 | 2,084.6 | 1,775.4 | 1,589.4 | per 100,000 | |
| D02a - Chlamydia detection rate per 100,000 aged 15 to 24 years | 15-24 yrs | Male | 2024 | 854.1 | 908.7 | 837.2 | per 100,000 | |
| D02a - Chlamydia detection rate per 100,000 aged 15 to 24 years | 15-24 yrs | Persons | 2024 | 1,452.5 | 1,351.5 | 1,249.8 | per 100,000 | |
| D08a - Proportion of drug sensitive TB notifications who had completed a full course of treatment by 12 months | All ages | Persons | 2023 | NA | 79.2 | 84.4 | % | |
| D08b - TB incidence (three year average) | All ages | Persons | 2022 - 24 | 3.5 | 8.0 | 8.5 | per 100,000 | |
| D10 - Adjusted antibiotic prescribing in primary care by the NHS | All ages | Persons | 2024 | 0.9 | 0.9 | 0.9 | per STAR-PU | |
| Source: OHID Fingertips | ||||||||
| E. Healthcare and Premature Mortality | ||||||||
| Indicator | Age | Sex | Period | Value | East Midlands region | England | Unit | Recent Trend |
|---|---|---|---|---|---|---|---|---|
| E01 - Infant mortality rate | <1 yr | Persons | 2022 - 24 | 3.2 | 4.6 | 4.2 | per 1,000 | |
| E02 - Percentage of 5 year olds with experience of visually obvious dental decay | 5 yrs | Persons | 2023/24 | 22.7 | 21.5 | 22.4 | % | |
| E03 - Under 75 mortality rate from causes considered preventable | <75 yrs | Persons | 2024 | 200.3 | 158.3 | 145.8 | per 100,000 | |
| E03 - Under 75 mortality rate from causes considered preventable | <75 yrs | Persons | 2022 - 24 | 196.2 | 160.2 | 151.2 | per 100,000 | |
| E04a - Under 75 mortality rate from cardiovascular disease | <75 yrs | Persons | 2024 | 89.1 | 77.9 | 74.3 | per 100,000 | |
| E04a - Under 75 mortality rate from cardiovascular disease | <75 yrs | Persons | 2022 - 24 | 88.0 | 79.2 | 76.5 | per 100,000 | |
| E04b - Under 75 mortality rate from cardiovascular disease considered preventable | <75 yrs | Persons | 2022 - 24 | 36.5 | 32.2 | 30.2 | per 100,000 | |
| E05a - Under 75 mortality rate from cancer | <75 yrs | Persons | 2024 | 133.2 | 125.1 | 117.9 | per 100,000 | |
| E05a - Under 75 mortality rate from cancer | <75 yrs | Persons | 2022 - 24 | 137.0 | 125.6 | 120.3 | per 100,000 | |
| E05b - Under 75 mortality rate from cancer considered preventable | <75 yrs | Persons | 2022 - 24 | 52.9 | 51.1 | 48.6 | per 100,000 | |
| E06a - Under 75 mortality rate from liver disease | <75 yrs | Persons | 2024 | 27.0 | 22.6 | 20.1 | per 100,000 | |
| E06a - Under 75 mortality rate from liver disease | <75 yrs | Persons | 2022 - 24 | 26.7 | 23.0 | 21.1 | per 100,000 | |
| E06b - Under 75 mortality rate from liver disease considered preventable | <75 yrs | Persons | 2022 - 24 | 22.9 | 20.7 | 18.9 | per 100,000 | |
| E07a - Under 75 mortality rate from respiratory disease | <75 yrs | Persons | 2024 | 44.5 | 32.8 | 32.7 | per 100,000 | |
| E07a - Under 75 mortality rate from respiratory disease | <75 yrs | Persons | 2022 - 24 | 39.8 | 31.8 | 32.4 | per 100,000 | |
| E07b - Under 75 mortality rate from respiratory disease considered preventable | <75 yrs | Persons | 2022 - 24 | 25.5 | 19.4 | 19.3 | per 100,000 | |
| E08 - Mortality rate from a range of specified communicable diseases, including influenza | All ages | Persons | 2022 - 24 | 18.5 | 14.5 | 15.2 | per 100,000 | |
| E10 - Suicide rate | 10+ yrs | Persons | 2022 - 24 | 16.4 | 11.8 | 10.9 | per 100,000 | |
| E11 - Emergency readmissions within 30 days of discharge from hospital | All ages | Persons | 2024/25 | 21.2 | 15.1 | 14.7 | % | |
| E13 - Hip fractures in people aged 65 and over | 65+ yrs | Persons | 2023/24 | 440.2 | 556.0 | 547.1 | per 100,000 | |
| E13 - Hip fractures in people aged 65 to 79 | 65-79 yrs | Persons | 2023/24 | 236.0 | 240.7 | 237.8 | per 100,000 | |
| E13 - Hip fractures in people aged 80 and over | 80+ yrs | Persons | 2023/24 | 1,032.2 | 1,470.3 | 1,443.8 | per 100,000 | |
| E14 - Winter mortality index (age 85 plus) | 85+ yrs | Persons | Aug 2021 - Jul 2022 | 14.3 | 8.5 | 11.3 | % | |
| E14 - Winter mortality index | All ages | Persons | Aug 2021 - Jul 2022 | 6.9 | 6.5 | 8.1 | % | |
| E15 - Estimated dementia diagnosis rate (aged 65 and older) | 65+ yrs | Persons | 2025 | 66.5 | 67.8 | 65.6 | per 100 | |
| Source: OHID Fingertips | ||||||||
Prevalence Maps of Derbyshire
The maps below illustrate various geographies for Derbyshire. LSOAs and MSOAs are geographical divisions used for statistical purposes, allowing for more detailed analysis of local data. In these maps, you can explore various health indicators and data for Derbyshire, providing valuable insights into the area’s health and wellbeing.
Wards Data Not Available
Data for this geography is not yet available. Please check back later.
Districts Data Not Available
Data for this geography is not yet available. Please check back later.
 |
In the top right of the map, you’ll find the ‘Layer Control’ icon. This is an easy way to customise what you see on the map visualisation. Click the ‘Layer Control’ to choose which information is displayed on the map. Pick the indicator that interests you the most, and the map will transform accordingly. |
 Further Analysis & Assessments
Derbyshire Joint Strategic Needs Assessment (JSNA) involves a thorough examination of a specific health problem, exploring its causes, consequences, and underlying factors. It combines various data sources, collaboration with stakeholders, and rigorous analysis to generate insights for evidence-informed interventions and policy changes.
 More Information & Resources
Contributors
Helen Marples, Service Development Officer, Chesterfield