| Population by Age and Area | ||||
| Area | 0 - 15 years | 16 - 64 years | 65+ years | Total |
|---|---|---|---|---|
| Derby | 54,956 | 174,676 | 44,517 | 274,149 |
| Derbyshire | 137,322 | 499,035 | 186,020 | 822,377 |
| Amber Valley | 21,569 | 78,858 | 30,024 | 130,451 |
| Bolsover | 14,300 | 52,218 | 17,255 | 83,773 |
| Chesterfield | 17,604 | 64,755 | 23,686 | 106,045 |
| Derbyshire Dales | 10,111 | 40,615 | 21,031 | 71,757 |
| Erewash | 19,174 | 70,825 | 24,254 | 114,253 |
| High Peak | 14,973 | 55,690 | 21,296 | 91,959 |
| North East Derbyshire | 17,684 | 62,527 | 26,435 | 106,646 |
| South Derbyshire | 21,907 | 73,547 | 22,039 | 117,493 |
| Source: Mid-year estimates 2024 | ||||
Derbyshire Dales
Locality
Derbyshire Dales
Diabetes
Dementia
Smoking
Ageing Population
Demographics
 Introduction
Derbyshire Dales is a predominantly rural district much of which is in the Peak District National Park, made up of small villages and historic market towns dispersed across the area. Approximately 80% of its population reside in rural settlements. It includes the market towns of Ashbourne, Bakewell, Matlock and Wirksworth and is situated in the west of Derbyshire, bordering Staffordshire.
The Derbyshire Dales has deep agricultural roots and played a pivotal role in the industrial revolution with several industries such as cotton and textiles, Lead mining and Limestone quarrying leaving a legacy. Vein minerals continue to be mined—while limestone is extensively quarried for use as aggregate. Today the modern economy is shaped by its rural character, tourism appeal and small business. With accommodation and food services being the largest employment sector. Derbyshire Dales is home to notable landmarks such as Chatsworth House - a grand stately Home and gardens, Cromford Mills- UNESCO World Heritage Site and birthplace of the industrial revolution, Eyam - historic Village known for its self-imposed plague quarantine and Dovedale, famous for its ravine and stepping stones.
The district has the lowest population in Derbyshire. It also has the highest proportion of residents aged 65 and over in the county. Since 2011, Derbyshire Dales has been among the top three local authorities in England and Wales with the largest increase in the 65+ age group. By 2043, it is projected that 34.7% of the population will be aged over 65.
Overall, Derbyshire Dales is less deprived than the national average and is considered the most affluent district in Derbyshire. However, the Index of Multiple Deprivation identifies the LSOA of Hurst Farm in Matlock as a notable exception, ranking among the top 10% most deprived areas in England.
Despite its relative prosperity, the district faces several challenges. These include a significant number of older adults who are “asset rich but cash poor”, high median house prices, fuel poverty, seasonal employment and elevated levels of unemployment and economic inactivity. The area also experiences a high incidence of road traffic casualties and has the longest travel time to a GP in the county.
With large areas of countryside separating towns and villages, and limited public transport options and digital deprivation, accessibility and affordability remain key barriers for residents seeking health-related services and support.
Derbyshire Dales is served by one Primary Care Network (PCN): Derbyshire Dales PCN.
There are no acute hospitals within the Derbyshire Dales, residents’ access acute care at
- University Hospitals of Derby and Burton
- Chesterfield Royal Hospital
There are two community hospitals Whitworth Hospital, Matlock (also an Urgent Treatment Centre) and St Oswald’s Hospital in Ashbourne managed by Derbyshire Community Health Services NHS Foundation Trust (DCHS).
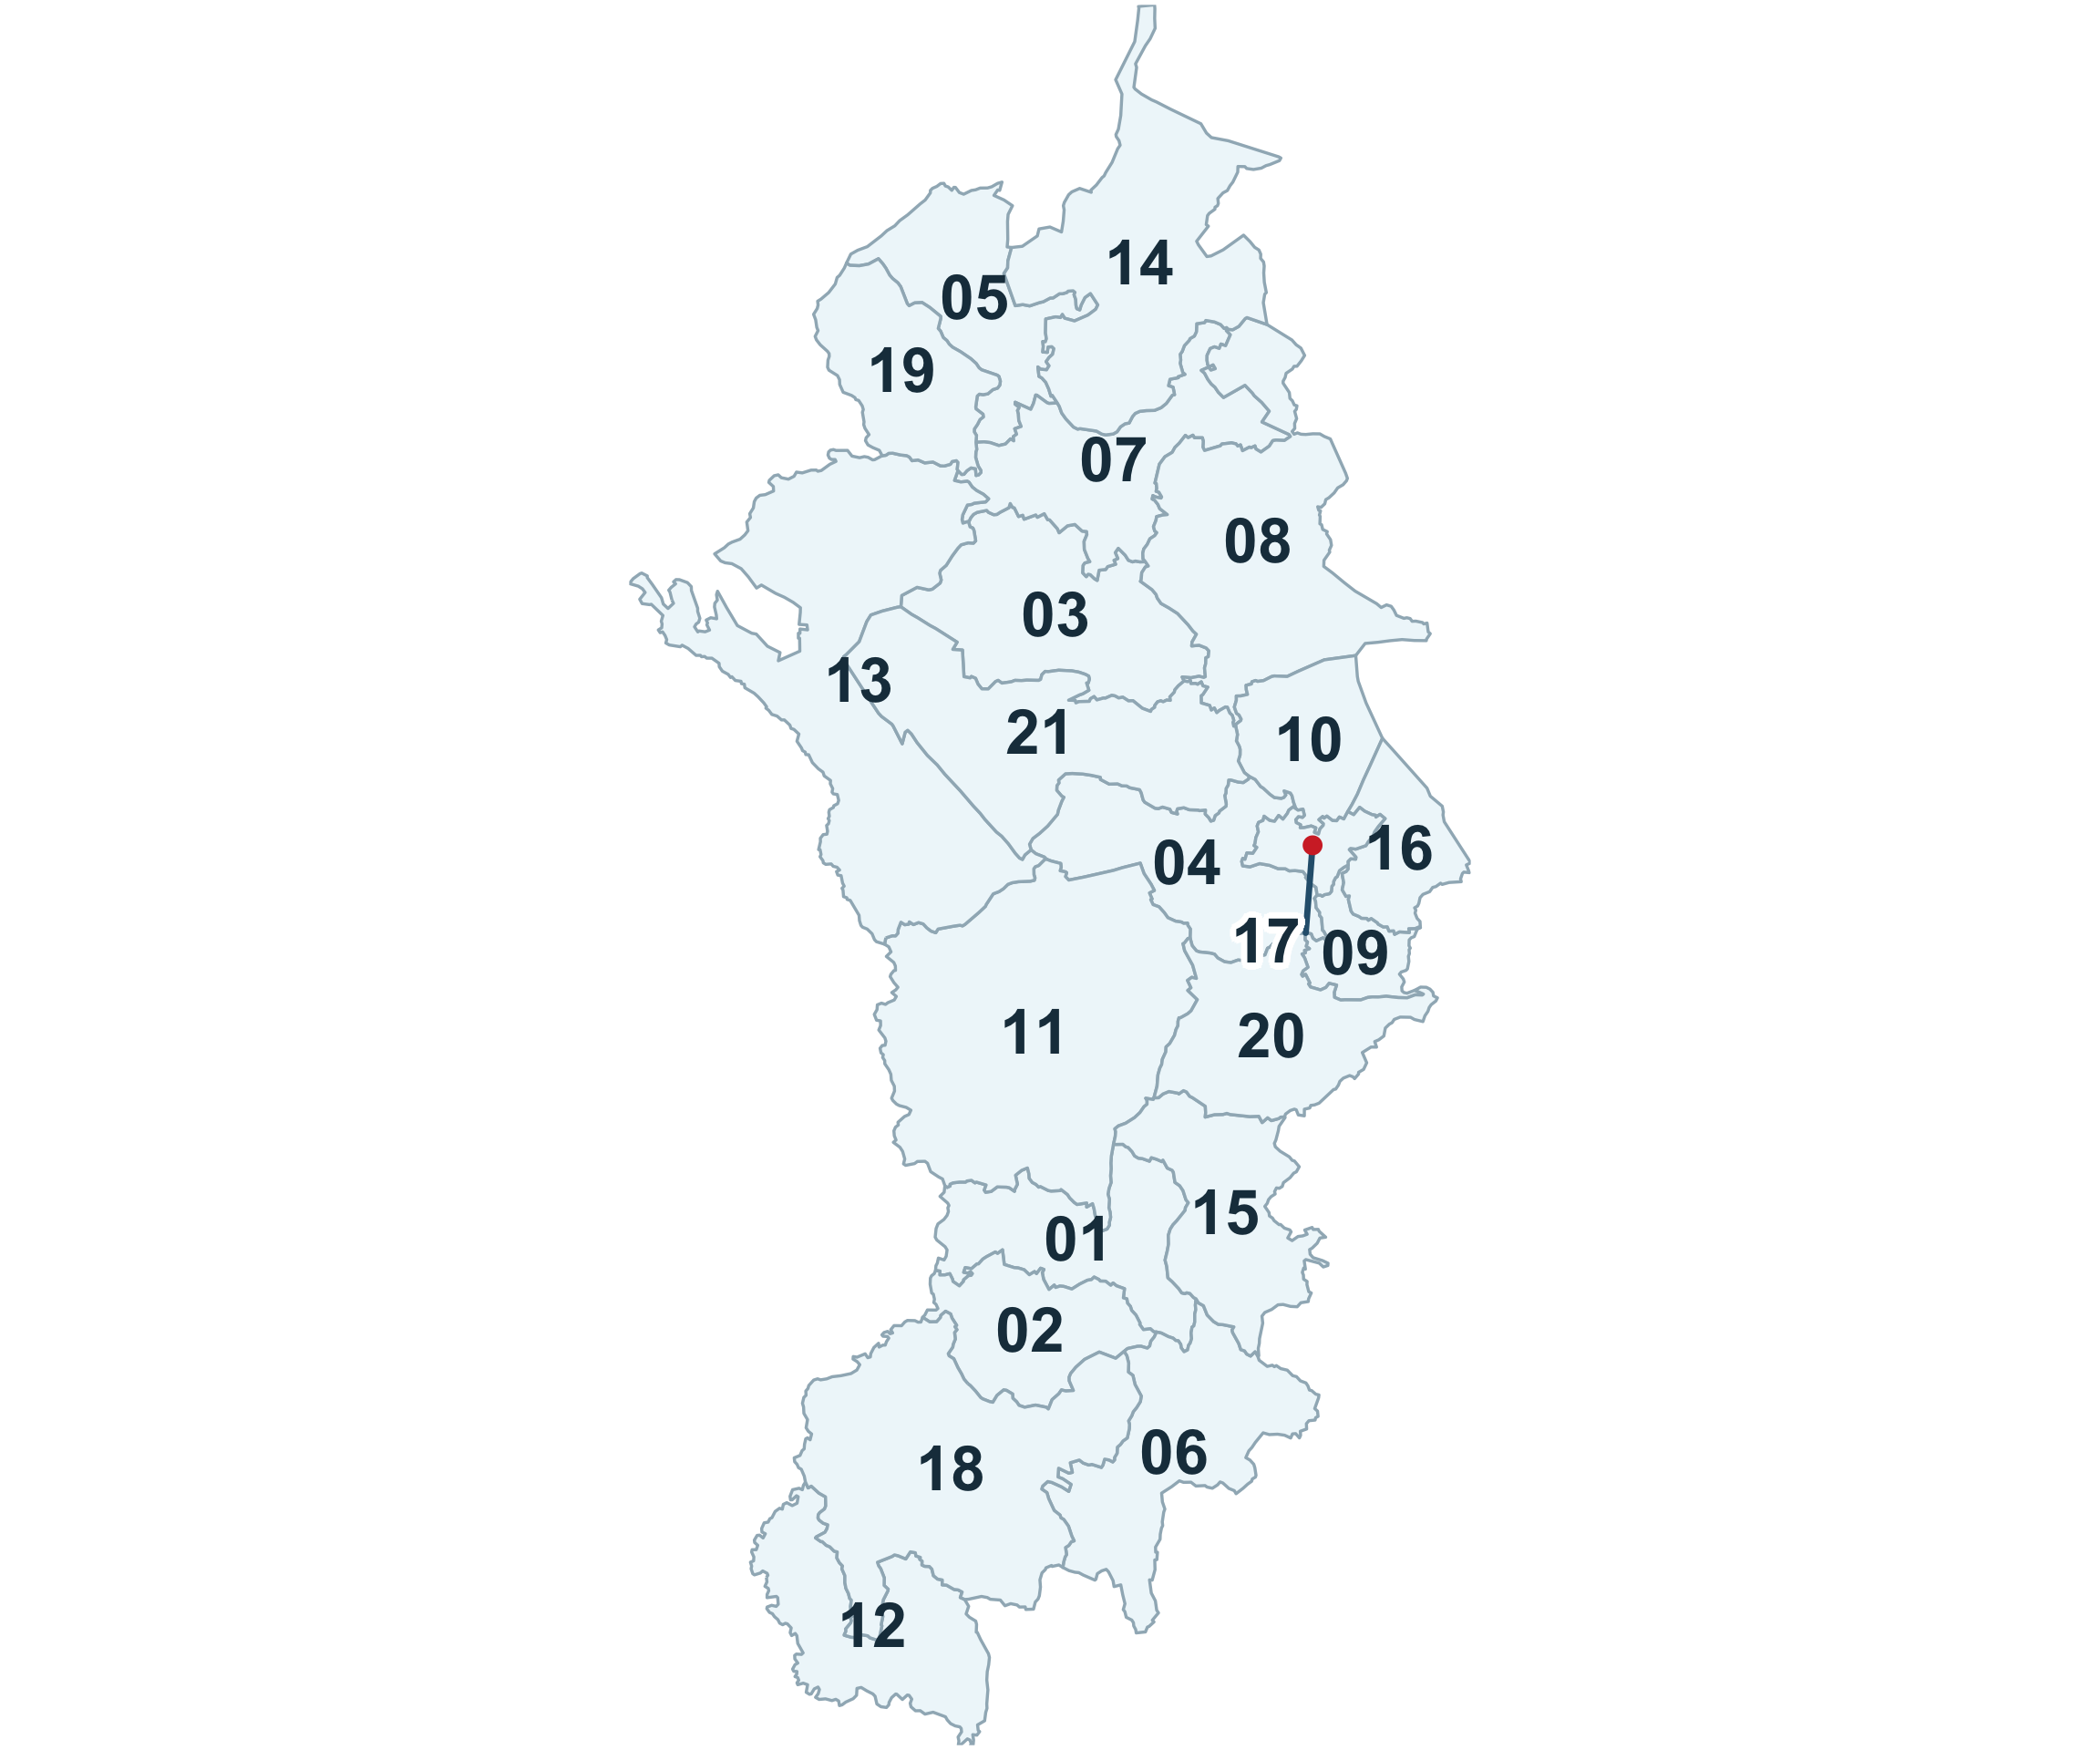
WARD REFERENCE
01: Ashbourne North
02: Ashbourne South
03: Bakewell
04: Bonsall & Winster
05: Bradwell
06: Brailsford
07: Calver & Longstone
08: Chatsworth
09: Cromford & Matlock Bath
10: Darley Dale
11: Dovedale, Parwich & Brassington
12: Doveridge & Sudbury
13: Hartington & Taddington
14: Hathersage
15: Hulland
16: Matlock East & Tansley
17: Matlock West
18: Norbury
19: Tideswell
20: Wirksworth
21: Youlgrave
 Why is it important to Population Health?
Health inequalities are the unfair and preventable differences in health outcomes that exist between different groups or communities. These differences are often shaped by broader social, economic, and environmental conditions that influence people’s lives, including their living environment, experiences, and access to services.
Derbyshire Dales is a relatively small and rural district with a growing older population. This demographic shift places increasing pressure on health and social care services that support older adults. At the same time, there are fewer households with children compared to other areas, which also influences the types of services in demand.
While access to GP and dental services is generally good, the rural nature of the district presents challenges. People living in more remote areas may face longer travel times to reach healthcare and other essential services. Public transport is limited, and those without access to a car may find it difficult to attend appointments, access employment, or buy affordable, healthy food.
Although general health in the area is often reported as better than in other parts of the county, there are still concerns around physical activity and healthy eating. These lifestyle factors are important for maintaining good health and preventing long-term conditions.
Transport barriers, rural isolation, and limited access to services can contribute to poorer health outcomes, particularly for older adults, low-income households, and people with mobility issues. Tackling these challenges is essential to improving population health and reducing inequalities across the district.
While Derbyshire Dales is generally considered a prosperous area with better-than-average health outcomes, however, there are pockets of deprivation and health inequalities across the district, which are often masked in small area statistics along with the presence of a highly deprived neighbourhood of Hurst Farm in Matlock which ranks among the most deprived in England reveals that not all communities share equally in those benefits.
Data from Public Health Outcomes Framework identifies the following indicators where Derbyshire Dales is worse than England averages
- Percentage of people aged 16+ reporting a long-term musculoskeletal problem (21.1%)
- Number of deaths from suicide (33)
- Of the number of people aged 65 and over, estimated to potentially have dementia, 49.7% of people have been formally diagnosed
- Estimated diabetes diagnosis rate (69.2%)
- Admission episodes for alcohol-related conditions for females (460 per 100,000)
- Smoking status at the time of delivery (11.9%)
- Percentage of people who report having a limiting long-term illness or disability (18.5% of population)
- Emergency readmissions within 30 days of discharge from hospital 16.7%
 The Derbyshire Population Health Approach
The Derbyshire Population Health Approach focuses on prevention, population health, evidence-informed practices, causes, and collaboration. It emphasises proactive measures to prevent health issues, tailors interventions to specific populations, incorporates evidence-informed practices, addresses underlying causes, and promotes collaboration for effective action.
When considering Derbyshire Dales within The Derbyshire Population Health Approach:
• Prevention
The Dales Local Integration Group (DLIG) group is unique in the county as it is an integrated group undertaking the work of the local Health & Wellbeing Partnership and NHS Place Alliance. 90 plus partners are engaged in the DLIG which includes representatives from Joined-Up Care Derbyshire, Voluntary, Community and Social Enterprises. (VCSE), Derbyshire Dales District Council, Derbyshire County Council, Active Derbyshire and the Peak District National Park Authority. The DLIG strives to improve the health and wellbeing of communities in the Derbyshire Dales and to reduce health inequalities through place-based and community partnership approaches.
The DLIG aims to undertake all activity by working to the below principles:
- Working in partnership to add value to existing resources and programmes and avoid duplication. The DLIG will work collaboratively across other networks and forums, including Community and Voluntary Sector networks and the Community Safety Partnership, to ensure our work is well informed and connected to wider developments.
- Considering the evidence-base to understand best practice to address each of our focus areas.
- Developing a local action plan for delivery against these focus areas, that focuses on our specific population groups identified above and identifies some key actions that partners can take together to progress our agenda.
- Proactively share knowledge, information and good practice. This includes networking to learn about best practice elsewhere and then collectively considering how we might be able to use this learning to influence our practice locally.
- Utilising creative approaches to making the best use of locality funding and resources and where appropriate submit joint applications for external sources of funding.
- Empower communities and local people to have a voice in planning and decision making
- Strengthen personal and community assets – physical, emotional, social and financial; grow skills and network

Health inequalities in Derbyshire Dales are influenced by a combination of rural isolation, an ageing population, and pockets of socio-economic deprivation. While the district is generally more affluent than other areas in Derbyshire, this overall prosperity can mask significant disparities in health outcomes—particularly in communities like Hurst Farm in Matlock, which ranks among the most deprived in England.
Residents in these more deprived areas often face poorer physical and mental health, shorter life expectancy, and greater difficulty accessing services.
The rural geography of the district adds to these challenges, with limited public transport and long travel distances making it harder for some people—especially those without a car—to reach healthcare, employment, and healthy food options.
• Evidence
Priorities and areas of focus for the DLIG are shaped by data and local insights alongside a review of current local initiatives and their effectiveness. This process is further informed by feedback from partners, community organisations, and direct engagement with residents to better understand service gaps and barriers to access.
By combining these data sources, The DLIG and partners are able to make informed decisions about service delivery, identify where improvements are needed, and guide the development and funding of future projects that respond to the specific needs of the district.
• Causes
Tackling health inequalities is essential to improving population health in Derbyshire Dales, where rural isolation, an ageing population, and pockets of deprivation contribute to uneven health outcomes. A deeper understanding of the underlying causes helps shape more effective, targeted interventions.
Poverty and Deprivation
Poverty and deprivation in the Derbyshire Dales are driven by a combination of low incomes, high living costs, and rural isolation. Many people work in low-paid or seasonal jobs, particularly in tourism, agriculture, and care, which can lead to financial insecurity. Housing costs are high compared to local wages, and some households struggle with fuel poverty. In more remote areas, limited access to transport, services, and employment opportunities increases social and economic exclusion.
Addressing these inequalities requires a place-based approach that recognises the hidden nature of deprivation in otherwise prosperous areas.
Physical Wellbeing
While many residents enjoy access to green spaces and outdoor activities, not all communities benefit equally. Barriers such as transport, cost, and confidence can prevent people—especially older adults and those in isolated areas—from engaging in regular physical activity. Programmes that support active lifestyles and remove these barriers are vital to improving long-term health outcomes.
Limited pavement access makes walking, wheeling, and cycling difficult, which can affect both physical and mental health. It also leads to more car use, adding to air pollution and traffic—especially in places like Ashbourne where air quality is already poor.
Older adults, people with disabilities, and those in disadvantaged areas are most affected, facing higher risks of injury and isolation due to unsafe walking routes.
Local efforts like the Walk Derbyshire programme aim to improve walking routes, especially in areas with health inequalities. Parish Wardens and community groups also help by checking and reporting problems with footpaths and rights of way.
Environmental Wellbeing
Buxton Road in Ashbourne has poor air quality, mainly due to traffic-related nitrogen dioxide (NO₂). Air pollution is one of the most harmful environmental risks to health. It’s linked to heart and lung diseases, asthma, stroke, and cancer. Children, older adults, people with existing health conditions, and those in disadvantaged areas are most affected.
Flooding in the Derbyshire Dales has caused serious problems for people’s health, local infrastructure, and the environment—especially with more extreme weather in recent years. It can lead to physical health risks from dirty water, mould, and disrupted medical care, as well as mental health issues like stress and anxiety. Older adults, people with existing health conditions, and those living in disadvantaged areas are most at risk.
Derbyshire Dales has been designated a radon affected area. This means that the buildings in the area have a greater than 1 per cent chance of having a level of radon which is higher than the action level set by government. Radon is the biggest contribution to radiation exposure of the UK population, and it can be dangerous. When radon decays it forms tiny radioactive particles that may be breathed into the lungs. Radiation from these particles can cause lung cancer that may take many years to develop. The lung cancer radon causes proceeds in the same way as cancer caused by smoking. Smoking and exposure to radon are known to work together to greatly increase the risk of developing lung cancer and smokers living in these areas are at a much greater risk and Cancer Research UK believe a smoker is 25 times more likely to get lung cancer if they live in a house affected by radon.
Social Wellbeing
While the Derbyshire Dales has a strong sense of community, social isolation is a growing concern—particularly among older adults and those living in rural or remote areas. Contributing factors include limited public transport, financial hardship, and health conditions, which can make it difficult for people to access services, social activities, and support networks. Strengthening the local voluntary and community sector is essential to help residents build meaningful social connections.
Digital Inclusion
Digital inclusion remains a barrier for some residents, particularly older adults and those in low-income households. Limited digital skills or access to devices availability of reliable high-speed broadband can prevent people from using online health services, accessing information, or staying connected. Improving digital inclusion is essential to ensuring equitable access to care and support.
• Collaboration
At the local level, efforts to reduce health inequalities in Derbyshire Dales are driven by strong collaboration between stakeholders, sectors, and communities. This joined-up approach ensures a shared vision and purpose, enabling partners to work together effectively, share resources, and avoid duplication of services.
The Derbyshire Dales Integrated Locality Group (DLIG) plays a central role in improving health and wellbeing across the district. Through a place-based and community partnership approach, DILIG focuses on addressing local needs as outlined in its Locality Plan, which prioritises:
- Mental Health and Wellbeing
- Financial Inclusion
- Barriers: Rural Transport and Digital Access
- Healthy Ageing
These priorities guide the use of the Public Health Locality Fund and help shape how local capacity and resources are allocated.
Over 90 partners are actively engaged in DLIG. The group is structured into two main components:
- DLIG Partnership Group – Provides a platform for sharing good practice, addressing local issues, and delivering on the priorities of the Locality Plan..
- DLIG Partnership Group – Provides a platform for sharing good practice, addressing local issues, and delivering on the priorities of the Locality Plan.
DLIG also supports several working subgroups, each focused on specific themes:
- Financial Wellbeing
- Team Up
- Walk Derbyshire
- Social Connectedness
- Mental Health
- Communication and Engagement This work aligns with the Derbyshire Joint Local Health and Wellbeing Strategy 2024–2027 and complements the priorities of the Integrated Care System (Joined Up Care Derbyshire).
 Latest Derbyshire Data
| Population in each IMD Decile by Area (count) | |||||||||||
| Area | 1 - Most deprived | 2 | 3 | 4 | 5 | 6 | 7 | 8 | 9 | 10 - Least deprived | Total |
|---|---|---|---|---|---|---|---|---|---|---|---|
| Derby | 57301 | 45294 | 24928 | 17295 | 22316 | 20465 | 7866 | 17904 | 18804 | 31447 | 263620 |
| Derbyshire | 42201 | 71195 | 80125 | 92050 | 91080 | 70384 | 105556 | 94952 | 84076 | 71836 | 803455 |
| Amber Valley | 5043 | 12740 | 5635 | 17589 | 21197 | 6329 | 15897 | 19090 | 12087 | 11327 | 126934 |
| Bolsover | 4726 | 14880 | 7410 | 21103 | 13929 | 4155 | 7774 | 5976 | 1588 | 0 | 81541 |
| Chesterfield | 12280 | 13362 | 24337 | 12221 | 2668 | 10375 | 10834 | 3027 | 5199 | 9801 | 104104 |
| Derbyshire Dales | 1533 | 0 | 0 | 4696 | 6772 | 14226 | 16350 | 16920 | 10207 | 1051 | 71755 |
| Erewash | 8990 | 12594 | 13767 | 6482 | 11797 | 9358 | 12235 | 12184 | 17110 | 8556 | 113073 |
| High Peak | 4162 | 4226 | 7878 | 7024 | 12903 | 10094 | 15338 | 17539 | 1233 | 10709 | 91106 |
| North East Derbyshire | 3968 | 9515 | 13444 | 10459 | 11240 | 10690 | 11304 | 5780 | 11672 | 15725 | 103797 |
| South Derbyshire | 1499 | 3878 | 7654 | 12476 | 10574 | 5157 | 15824 | 14436 | 24980 | 14667 | 111145 |
| Source: Ministry of Housing, Communities and Local Government IMD 2025, ONS LSOA mid-year population estimates 2022 | |||||||||||
| Population in each IMD Decile by Area (percentage) | |||||||||||
| Area | 1 - Most deprived | 2 | 3 | 4 | 5 | 6 | 7 | 8 | 9 | 10 - Least deprived | Total |
|---|---|---|---|---|---|---|---|---|---|---|---|
| Derby | 21.7% | 17.2% | 9.5% | 6.6% | 8.5% | 7.8% | 3% | 6.8% | 7.1% | 11.9% | 263620 |
| Derbyshire | 5.3% | 8.9% | 10% | 11.5% | 11.3% | 8.8% | 13.1% | 11.8% | 10.5% | 8.9% | 803455 |
| Amber Valley | 4% | 10% | 4.4% | 13.9% | 16.7% | 5% | 12.5% | 15% | 9.5% | 8.9% | 126934 |
| Bolsover | 5.8% | 18.2% | 9.1% | 25.9% | 17.1% | 5.1% | 9.5% | 7.3% | 1.9% | 0 | 81541 |
| Chesterfield | 11.8% | 12.8% | 23.4% | 11.7% | 2.6% | 10% | 10.4% | 2.9% | 5% | 9.4% | 104104 |
| Derbyshire Dales | 2.1% | 0 | 0 | 6.5% | 9.4% | 19.8% | 22.8% | 23.6% | 14.2% | 1.5% | 71755 |
| Erewash | 8% | 11.1% | 12.2% | 5.7% | 10.4% | 8.3% | 10.8% | 10.8% | 15.1% | 7.6% | 113073 |
| High Peak | 4.6% | 4.6% | 8.6% | 7.7% | 14.2% | 11.1% | 16.8% | 19.3% | 1.4% | 11.8% | 91106 |
| North East Derbyshire | 3.8% | 9.2% | 13% | 10.1% | 10.8% | 10.3% | 10.9% | 5.6% | 11.2% | 15.1% | 103797 |
| South Derbyshire | 1.3% | 3.5% | 6.9% | 11.2% | 9.5% | 4.6% | 14.2% | 13% | 22.5% | 13.2% | 111145 |
| Source: Ministry of Housing, Communities and Local Government IMD 2025, ONS LSOA mid-year population estimates 2022 | |||||||||||
| Population by Ethnicity (percentage) | |||||
| Area | Asian, Asian British or Asian Welsh | Black, Black British, Black Welsh, Caribbean or African | Mixed or Multiple ethnic groups | White | Other ethnic group |
|---|---|---|---|---|---|
| England | 9.6 | 4.2 | 3.0 | 81.0 | 2.2 |
| Derby | 15.6 | 4.0 | 3.7 | 73.8 | 2.9 |
| Derbyshire | 1.5 | 0.5 | 1.4 | 96.3 | 0.3 |
| Amber Valley | 1.0 | 0.3 | 1.2 | 97.3 | 0.2 |
| Bolsover | 0.9 | 0.5 | 0.9 | 97.4 | 0.3 |
| Chesterfield | 1.9 | 0.8 | 1.4 | 95.5 | 0.4 |
| Derbyshire Dales | 0.7 | 0.2 | 1.0 | 97.8 | 0.3 |
| Erewash | 1.6 | 0.8 | 1.8 | 95.4 | 0.4 |
| High Peak | 0.8 | 0.2 | 1.3 | 97.4 | 0.2 |
| North East Derbyshire | 0.9 | 0.3 | 1.1 | 97.4 | 0.2 |
| South Derbyshire | 3.6 | 0.8 | 1.8 | 93.1 | 0.7 |
| Source: Census 2021 | |||||
Trend Data
The following charts show life expectancy over time in Derbyshire by district and sex (compared to England)
PHOF Profile
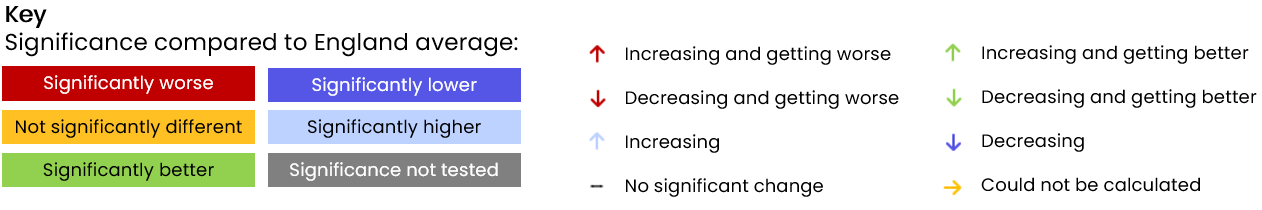
Notes:
- For indicators that aren’t straightforward to determine whether a high value is good or bad are shaded in blue rather than red/amber/green.
- Recent trend refers to analysis done by Fingertips which tests for a statistical trend. Please see the Fingertips tool for full details.
- Increases and decreases are only shown if they are statistically significant.
| A. Overarching indicators | ||||||||
| Indicator | Age | Sex | Period | Value | East Midlands region | England | Unit | Recent Trend |
|---|---|---|---|---|---|---|---|---|
| A01b - Life expectancy at 65 | 65 | Female | 2024 | 22.7 | 21.3 | 21.6 | Years | |
| A01b - Life expectancy at 65 | 65 | Female | 2022 - 24 | 22.1 | 21.0 | 21.4 | Years | |
| A01b - Life expectancy at 65 | 65 | Male | 2024 | 21.0 | 18.9 | 19.2 | Years | |
| A01b - Life expectancy at 65 | 65 | Male | 2022 - 24 | 20.3 | 18.7 | 18.9 | Years | |
| A01b - Life expectancy at birth | All ages | Female | 2024 | 84.9 | 83.1 | 83.6 | Years | |
| A01b - Life expectancy at birth | All ages | Female | 2022 - 24 | 84.7 | 82.8 | 83.3 | Years | |
| A01b - Life expectancy at birth | All ages | Male | 2024 | 83.0 | 79.3 | 79.8 | Years | |
| A01b - Life expectancy at birth | All ages | Male | 2022 - 24 | 81.4 | 79.0 | 79.5 | Years | |
| A02a - Inequality in life expectancy at 65 | 65 | Female | 2021 - 23 | 2.6 | 4.8 | 5.0 | Years | |
| A02a - Inequality in life expectancy at 65 | 65 | Male | 2021 - 23 | 1.9 | 5.3 | 5.6 | Years | |
| A02a - Inequality in life expectancy at birth | All ages | Female | 2021 - 23 | 2.9 | 7.9 | 8.3 | Years | |
| A02a - Inequality in life expectancy at birth | All ages | Male | 2021 - 23 | 4.3 | 10.1 | 10.5 | Years | |
| Source: OHID Fingertips | ||||||||
| B. Wider Determinants of Health | ||||||||
| Indicator | Age | Sex | Period | Value | East Midlands region | England | Unit | Recent Trend |
|---|---|---|---|---|---|---|---|---|
| 1.01i - Children in low income families (all dependent children under 20) | 0-19 yrs | Persons | 2016 | 9.3 | 16.3 | 17.0 | % | |
| B01b - Children in absolute low income families (under 16s) | <16 yrs | Persons | 2023/24 | 12.7 | 20.7 | 19.1 | % | |
| B01b - Children in relative low income families (under 16s) | <16 yrs | Persons | 2023/24 | 14.8 | 24.1 | 22.1 | % | |
| B03 - Pupil absence | 5-15 yrs | Persons | 2023/24 | 6.7 | 7.1 | 7.1 | % | |
| B08d - Percentage of people in employment | 16-64 yrs | Persons | 2024/25 | 65.1 | 74.9 | 75.7 | % | |
| B09a - Sickness absence: the percentage of employees who had at least one day off in the previous week | 16+ yrs | Persons | 2021 - 23 | NA | 2.1 | 2.2 | % | |
| B09b - Sickness absence: the percentage of working days lost due to sickness absence | 16+ yrs | Persons | 2021 - 23 | NA | 1.3 | 1.2 | % | |
| B12a - Violent crime - hospital admissions for violence (including sexual violence) | All ages | Persons | 2021/22 - 23/24 | 19.2 | 28.8 | 34.2 | per 100,000 | |
| B12b - Violent crime - violence offences per 1,000 population | All ages | Persons | 2024/25 | 17.3 | 29.7 | 31.4 | per 1,000 | |
| B12c - Violent crime - sexual offences per 1,000 population | All ages | Persons | 2024/25 | 2.0 | 3.2 | 3.1 | per 1,000 | |
| B13a - Reoffending levels: percentage of offenders who reoffend | All ages | Persons | 2022/23 | 17.5 | 27.6 | 26.2 | % | |
| B13b - Reoffending levels: average number of reoffences per reoffender | All ages | Persons | 2022/23 | 2.8 | 4.2 | 4.0 | per re-offender | |
| B14a - The rate of complaints about noise | All ages | Persons | 2023/24 | 2.6 | 5.3 | 5.9 | per 1,000 | |
| B14b - The percentage of the population exposed to road, rail and air transport noise of 65dB(A) or more, during the daytime | All ages | Persons | 2021 | 4.5 | 3.0 | 4.3 | % | |
| B14c - The percentage of the population exposed to road, rail and air transport noise of 55 dB(A) or more during the night-time | All ages | Persons | 2021 | 10.0 | 6.2 | 8.4 | % | |
| B15a - Homelessness: households owed a duty under the Homelessness Reduction Act | Not applicable | Not applicable | 2024/25 | 6.5 | 11.6 | 13.6 | per 1,000 | |
| B15c - Homelessness: households in temporary accommodation | Not applicable | Not applicable | 2024/25 | 0.3 | 2.0 | 5.2 | per 1,000 | |
| B17 - Fuel poverty (low income, low energy efficiency methodology) | Not applicable | Not applicable | 2023 | 13.8 | 11.7 | 11.4 | % | |
| Source: OHID Fingertips | ||||||||
| C. Health Improvement | ||||||||
| Indicator | Age | Sex | Period | Value | East Midlands region | England | Unit | Recent Trend |
|---|---|---|---|---|---|---|---|---|
| C01 - Total prescribed LARC excluding injections rate / 1,000 | All ages | Female | 2024 | 73.9 | 41.6 | 40.0 | per 1,000 | |
| C04 - Low birth weight of term babies | >=37 weeks gestational age at birth | Persons | 2024 | 1.1 | 2.8 | 3.0 | % | |
| C06 - Smoking status at time of delivery | All ages | Female | 2024/25 | 8.0 | 7.9 | 6.1 | % | |
| C09a - Reception prevalence of overweight (including obesity) | 4-5 yrs | Persons | 2024/25 | 24.5 | 23.7 | 23.5 | % | |
| C09b - Year 6 prevalence of overweight (including obesity) | 10-11 yrs | Persons | 2024/25 | 29.7 | 36.3 | 36.2 | % | |
| C10 - Percentage of physically active children and young people | 5-16 yrs | Persons | 2024/25 | NA | 48.9 | 49.1 | % | |
| C11a - Hospital admissions caused by unintentional and deliberate injuries in children (aged 0 to 14 years) | <15 yrs | Persons | 2023/24 | 58.2 | 54.9 | 72.7 | per 10,000 | |
| C11a - Hospital admissions caused by unintentional and deliberate injuries in children (aged 0 to 4 years) | 0-4 yrs | Persons | 2023/24 | 39.0 | 68.3 | 93.2 | per 10,000 | |
| C11b - Hospital admissions caused by unintentional and deliberate injuries in young people (aged 15 to 24 years) | 15-24 yrs | Persons | 2023/24 | 73.9 | 79.2 | 88.6 | per 10,000 | |
| C14b - Emergency Hospital Admissions for Intentional Self-Harm | All ages | Persons | 2023/24 | 82.4 | 128.1 | 117.0 | per 100,000 | |
| C15 - Percentage of adults meeting the '5-a-day' fruit and vegetable consumption recommendations (new method) | 16+ yrs | Persons | 2023/24 | 46.6 | 30.1 | 31.3 | % | |
| C15 - Proportion of the population meeting the recommended '5 a day' on a 'usual day' (adults) (old method) | 16+ yrs | Persons | 2019/20 | 67.5 | 55.0 | 55.4 | % | |
| C16 - Overweight (including obesity) prevalence in adults, (using adjusted self-reported height and weight) | 18+ yrs | Persons | 2023/24 | 60.6 | 67.1 | 64.5 | % | |
| C17a - Percentage of physically active adults | 19+ yrs | Persons | 2023/24 | 78.0 | 66.7 | 67.4 | % | |
| C17b - Percentage of physically inactive adults | 19+ yrs | Persons | 2023/24 | 15.6 | 22.7 | 22.0 | % | |
| C18 - Smoking Prevalence in adults (aged 18 and over) - current smokers (APS) | 18+ yrs | Persons | 2024 | 8.2 | 10.4 | 10.4 | % | |
| C18 - Smoking Prevalence in adults (aged 18 and over) - current smokers (APS) | 18+ yrs | Persons | 2022 - 24 | 6.0 | 11.6 | 10.9 | % | |
| C19d - Deaths from drug misuse | All ages | Persons | 2022 - 24 | NA | 5.9 | 5.8 | per 100,000 | |
| C21 - Admission episodes for alcohol-related conditions (Narrow) | All ages | Female | 2023/24 | 460.2 | 396.8 | 339.5 | per 100,000 | |
| C21 - Admission episodes for alcohol-related conditions (Narrow) | All ages | Male | 2023/24 | 499.5 | 724.9 | 686.5 | per 100,000 | |
| C21 - Admission episodes for alcohol-related conditions (Narrow) | All ages | Persons | 2023/24 | 478.1 | 553.6 | 504.1 | per 100,000 | |
| C22 - Estimated diabetes diagnosis rate | 17+ yrs | Persons | 2018 | 69.2 | 84.6 | 78.0 | % | |
| C23 - Percentage of cancers diagnosed at stages 1 and 2 | All ages | Persons | 2022 | 56.3 | 55.2 | 56.8 | % | |
| C24a - Cancer screening coverage: breast cancer | 53-70 yrs | Female | 2025 | 79.6 | 71.9 | 71.7 | % | |
| C24b - Cancer screening coverage: cervical cancer (aged 25 to 49 years old) | 25-49 yrs | Female | 2024 | 78.0 | 68.2 | 66.1 | % | |
| C24c - Cancer screening coverage: cervical cancer (aged 50 to 64 years old) | 50-64 yrs | Female | 2024 | 80.4 | 75.8 | 74.3 | % | |
| C24d - Cancer screening coverage: bowel cancer | 60-74 yrs | Persons | 2025 | 79.5 | 74.2 | 72.9 | % | |
| C24e - Abdominal Aortic Aneurysm Screening Coverage | 65 | Male | 2024/25 | 89.9 | 86.3 | 82.2 | % | |
| C27 - Percentage reporting a long-term Musculoskeletal (MSK) problem | 16+ yrs | Persons | 2023 | 21.1 | 20.0 | 18.4 | % | |
| C28a - Self reported wellbeing: people with a low satisfaction score | 16+ yrs | Persons | 2022/23 | NA | 6.5 | 5.6 | % | |
| C28b - Self reported wellbeing: people with a low worthwhile score | 16+ yrs | Persons | 2022/23 | NA | 4.4 | 4.4 | % | |
| C28c - Self reported wellbeing: people with a low happiness score | 16+ yrs | Persons | 2022/23 | NA | 9.3 | 8.8 | % | |
| C28d - Self reported wellbeing: people with a high anxiety score | 16+ yrs | Persons | 2022/23 | 30.5 | 21.5 | 23.3 | % | |
| C29 - Emergency hospital admissions due to falls in people aged 65 and over | 65+ yrs | Persons | 2023/24 | 1,330.6 | 1,908.5 | 1,984.0 | per 100,000 | |
| C29 - Emergency hospital admissions due to falls in people aged 65 to 79 | 65-79 yrs | Persons | 2023/24 | 559.1 | 908.4 | 954.7 | per 100,000 | |
| C29 - Emergency hospital admissions due to falls in people aged 80 plus | 80+ yrs | Persons | 2023/24 | 3,568.0 | 4,808.6 | 4,968.9 | per 100,000 | |
| Source: OHID Fingertips | ||||||||
| D. Health Protection | ||||||||
| Indicator | Age | Sex | Period | Value | East Midlands region | England | Unit | Recent Trend |
|---|---|---|---|---|---|---|---|---|
| D01 - Air pollution: estimated fraction of mortality attributable to particulate air pollution | 30+ yrs | Persons | 2024 | 4.7 | 5.4 | 5.3 | % | |
| D02a - Chlamydia detection rate per 100,000 aged 15 to 24 years | 15-24 yrs | Female | 2024 | 1,368.9 | 1,775.4 | 1,589.4 | per 100,000 | |
| D02a - Chlamydia detection rate per 100,000 aged 15 to 24 years | 15-24 yrs | Male | 2024 | 788.6 | 908.7 | 837.2 | per 100,000 | |
| D02a - Chlamydia detection rate per 100,000 aged 15 to 24 years | 15-24 yrs | Persons | 2024 | 1,099.8 | 1,351.5 | 1,249.8 | per 100,000 | |
| D08a - Proportion of drug sensitive TB notifications who had completed a full course of treatment by 12 months | All ages | Persons | 2023 | NA | 79.2 | 84.4 | % | |
| D08b - TB incidence (three year average) | All ages | Persons | 2022 - 24 | NA | 8.0 | 8.5 | per 100,000 | |
| D10 - Adjusted antibiotic prescribing in primary care by the NHS | All ages | Persons | 2024 | 0.8 | 0.9 | 0.9 | per STAR-PU | |
| Source: OHID Fingertips | ||||||||
| E. Healthcare and Premature Mortality | ||||||||
| Indicator | Age | Sex | Period | Value | East Midlands region | England | Unit | Recent Trend |
|---|---|---|---|---|---|---|---|---|
| E01 - Infant mortality rate | <1 yr | Persons | 2022 - 24 | 3.1 | 4.6 | 4.2 | per 1,000 | |
| E02 - Percentage of 5 year olds with experience of visually obvious dental decay | 5 yrs | Persons | 2023/24 | 12.3 | 21.5 | 22.4 | % | |
| E03 - Under 75 mortality rate from causes considered preventable | <75 yrs | Persons | 2024 | 96.1 | 158.3 | 145.8 | per 100,000 | |
| E03 - Under 75 mortality rate from causes considered preventable | <75 yrs | Persons | 2022 - 24 | 106.1 | 160.2 | 151.2 | per 100,000 | |
| E04a - Under 75 mortality rate from cardiovascular disease | <75 yrs | Persons | 2024 | 41.9 | 77.9 | 74.3 | per 100,000 | |
| E04a - Under 75 mortality rate from cardiovascular disease | <75 yrs | Persons | 2022 - 24 | 55.7 | 79.2 | 76.5 | per 100,000 | |
| E04b - Under 75 mortality rate from cardiovascular disease considered preventable | <75 yrs | Persons | 2022 - 24 | 20.3 | 32.2 | 30.2 | per 100,000 | |
| E05a - Under 75 mortality rate from cancer | <75 yrs | Persons | 2024 | 105.5 | 125.1 | 117.9 | per 100,000 | |
| E05a - Under 75 mortality rate from cancer | <75 yrs | Persons | 2022 - 24 | 102.2 | 125.6 | 120.3 | per 100,000 | |
| E05b - Under 75 mortality rate from cancer considered preventable | <75 yrs | Persons | 2022 - 24 | 34.7 | 51.1 | 48.6 | per 100,000 | |
| E06a - Under 75 mortality rate from liver disease | <75 yrs | Persons | 2024 | 16.3 | 22.6 | 20.1 | per 100,000 | |
| E06a - Under 75 mortality rate from liver disease | <75 yrs | Persons | 2022 - 24 | 15.0 | 23.0 | 21.1 | per 100,000 | |
| E06b - Under 75 mortality rate from liver disease considered preventable | <75 yrs | Persons | 2022 - 24 | 12.7 | 20.7 | 18.9 | per 100,000 | |
| E07a - Under 75 mortality rate from respiratory disease | <75 yrs | Persons | 2024 | 20.7 | 32.8 | 32.7 | per 100,000 | |
| E07a - Under 75 mortality rate from respiratory disease | <75 yrs | Persons | 2022 - 24 | 14.5 | 31.8 | 32.4 | per 100,000 | |
| E07b - Under 75 mortality rate from respiratory disease considered preventable | <75 yrs | Persons | 2022 - 24 | 7.7 | 19.4 | 19.3 | per 100,000 | |
| E08 - Mortality rate from a range of specified communicable diseases, including influenza | All ages | Persons | 2022 - 24 | 15.6 | 14.5 | 15.2 | per 100,000 | |
| E10 - Suicide rate | 10+ yrs | Persons | 2022 - 24 | 16.7 | 11.8 | 10.9 | per 100,000 | |
| E11 - Emergency readmissions within 30 days of discharge from hospital | All ages | Persons | 2024/25 | 17.4 | 15.1 | 14.7 | % | |
| E13 - Hip fractures in people aged 65 and over | 65+ yrs | Persons | 2023/24 | 311.0 | 556.0 | 547.1 | per 100,000 | |
| E13 - Hip fractures in people aged 65 to 79 | 65-79 yrs | Persons | 2023/24 | 98.7 | 240.7 | 237.8 | per 100,000 | |
| E13 - Hip fractures in people aged 80 and over | 80+ yrs | Persons | 2023/24 | 926.6 | 1,470.3 | 1,443.8 | per 100,000 | |
| E14 - Winter mortality index (age 85 plus) | 85+ yrs | Persons | Aug 2021 - Jul 2022 | 34.9 | 8.5 | 11.3 | % | |
| E14 - Winter mortality index | All ages | Persons | Aug 2021 - Jul 2022 | 17.3 | 6.5 | 8.1 | % | |
| E15 - Estimated dementia diagnosis rate (aged 65 and older) | 65+ yrs | Persons | 2025 | 51.8 | 67.8 | 65.6 | per 100 | |
| Source: OHID Fingertips | ||||||||
Prevalence Maps of Derbyshire
The maps below illustrate various geographies for Derbyshire. LSOAs and MSOAs are geographical divisions used for statistical purposes, allowing for more detailed analysis of local data. In these maps, you can explore various health indicators and data for Derbyshire, providing valuable insights into the area’s health and wellbeing.
Wards Data Not Available
Data for this geography is not yet available. Please check back later.
Districts Data Not Available
Data for this geography is not yet available. Please check back later.
 |
In the top right of the map, you’ll find the ‘Layer Control’ icon. This is an easy way to customise what you see on the map visualisation. Click the ‘Layer Control’ to choose which information is displayed on the map. Pick the indicator that interests you the most, and the map will transform accordingly. |
 Further Analysis & Assessments
Derbyshire Joint Strategic Needs Assessment (JSNA) involves a thorough examination of a specific health problem, exploring its causes, consequences, and underlying factors. It combines various data sources, collaboration with stakeholders, and rigorous analysis to generate insights for evidence-informed interventions and policy changes.
 More Information & Resources
Contributors
Claire Reece, Health Improvement Practitioner, Derbyshire Dales