| Population by Age and Area | ||||
| Area | 0 - 15 years | 16 - 64 years | 65+ years | Total |
|---|---|---|---|---|
| Derby | 54,956 | 174,676 | 44,517 | 274,149 |
| Derbyshire | 137,322 | 499,035 | 186,020 | 822,377 |
| Amber Valley | 21,569 | 78,858 | 30,024 | 130,451 |
| Bolsover | 14,300 | 52,218 | 17,255 | 83,773 |
| Chesterfield | 17,604 | 64,755 | 23,686 | 106,045 |
| Derbyshire Dales | 10,111 | 40,615 | 21,031 | 71,757 |
| Erewash | 19,174 | 70,825 | 24,254 | 114,253 |
| High Peak | 14,973 | 55,690 | 21,296 | 91,959 |
| North East Derbyshire | 17,684 | 62,527 | 26,435 | 106,646 |
| South Derbyshire | 21,907 | 73,547 | 22,039 | 117,493 |
| Source: Mid-year estimates 2024 | ||||
North East Derbyshire
Locality
North East Derbyshire
Diabetes
Dementia
Smoking
Ageing Population
Demographics

 Introduction
Nestled on the edge of the Peak District National Park, North East Derbyshire combines stunning rural landscapes with a rich industrial past. Renowned for its beautiful countryside and historic landmarks such as Renishaw Hall, the district offers a unique blend of heritage and modern regeneration.
Located in the East Midlands, North East Derbyshire spans over 107 square miles, surrounding Chesterfield on three sides and bordering Sheffield to the north. It is home to around 105,000 residents, with a near-even split between rural and urban communities. The district’s four main towns—Dronfield, Eckington, Killamarsh, and Clay Cross—are complemented by numerous villages and hamlets, creating a diverse and vibrant local character.
Historically, coal mining dominated the area for decades, shaping its identity and economy. The closure of collieries in the 1990s brought significant challenges, including high unemployment. Since then, major regeneration projects have transformed the district, introducing new housing, business parks, and industrial estates that have attracted investment and revitalized local communities.
Today, North East Derbyshire benefits from transport links, including the M1 (junctions 29, 29A, and 30) and the A61, making it well-connected for commuting and business. Dronfield’s railway station provides direct access to Sheffield and Chesterfield, while nearby stations link to Derby, Nottingham, and beyond.
Governance is shared between Derbyshire County Council and North East Derbyshire District Council, supported by active town and parish councils. Healthcare provision includes Chesterfield Royal Hospital NHS Foundation Trust, local GP practices, and five Primary Care Networks including South Hardwick, Chesterfield & Dronfield, Derbyshire Dales, North East Derbyshire, and North Hardwick & Bolsover PCN.
North East Derbyshire is a district of contrasts—where rolling hills meet industrial heritage, and where regeneration and community resilience continue to shape its future.
Despite its strengths, the district faces health and social challenges, ranking as the third most deprived area in Derbyshire, with pockets among the 20% most deprived nationally. These issues are often hidden within rural settings and require targeted, place-based approaches.
Collaborative work across councils, healthcare providers, and community organizations is ongoing to address these inequalities and improve wellbeing.
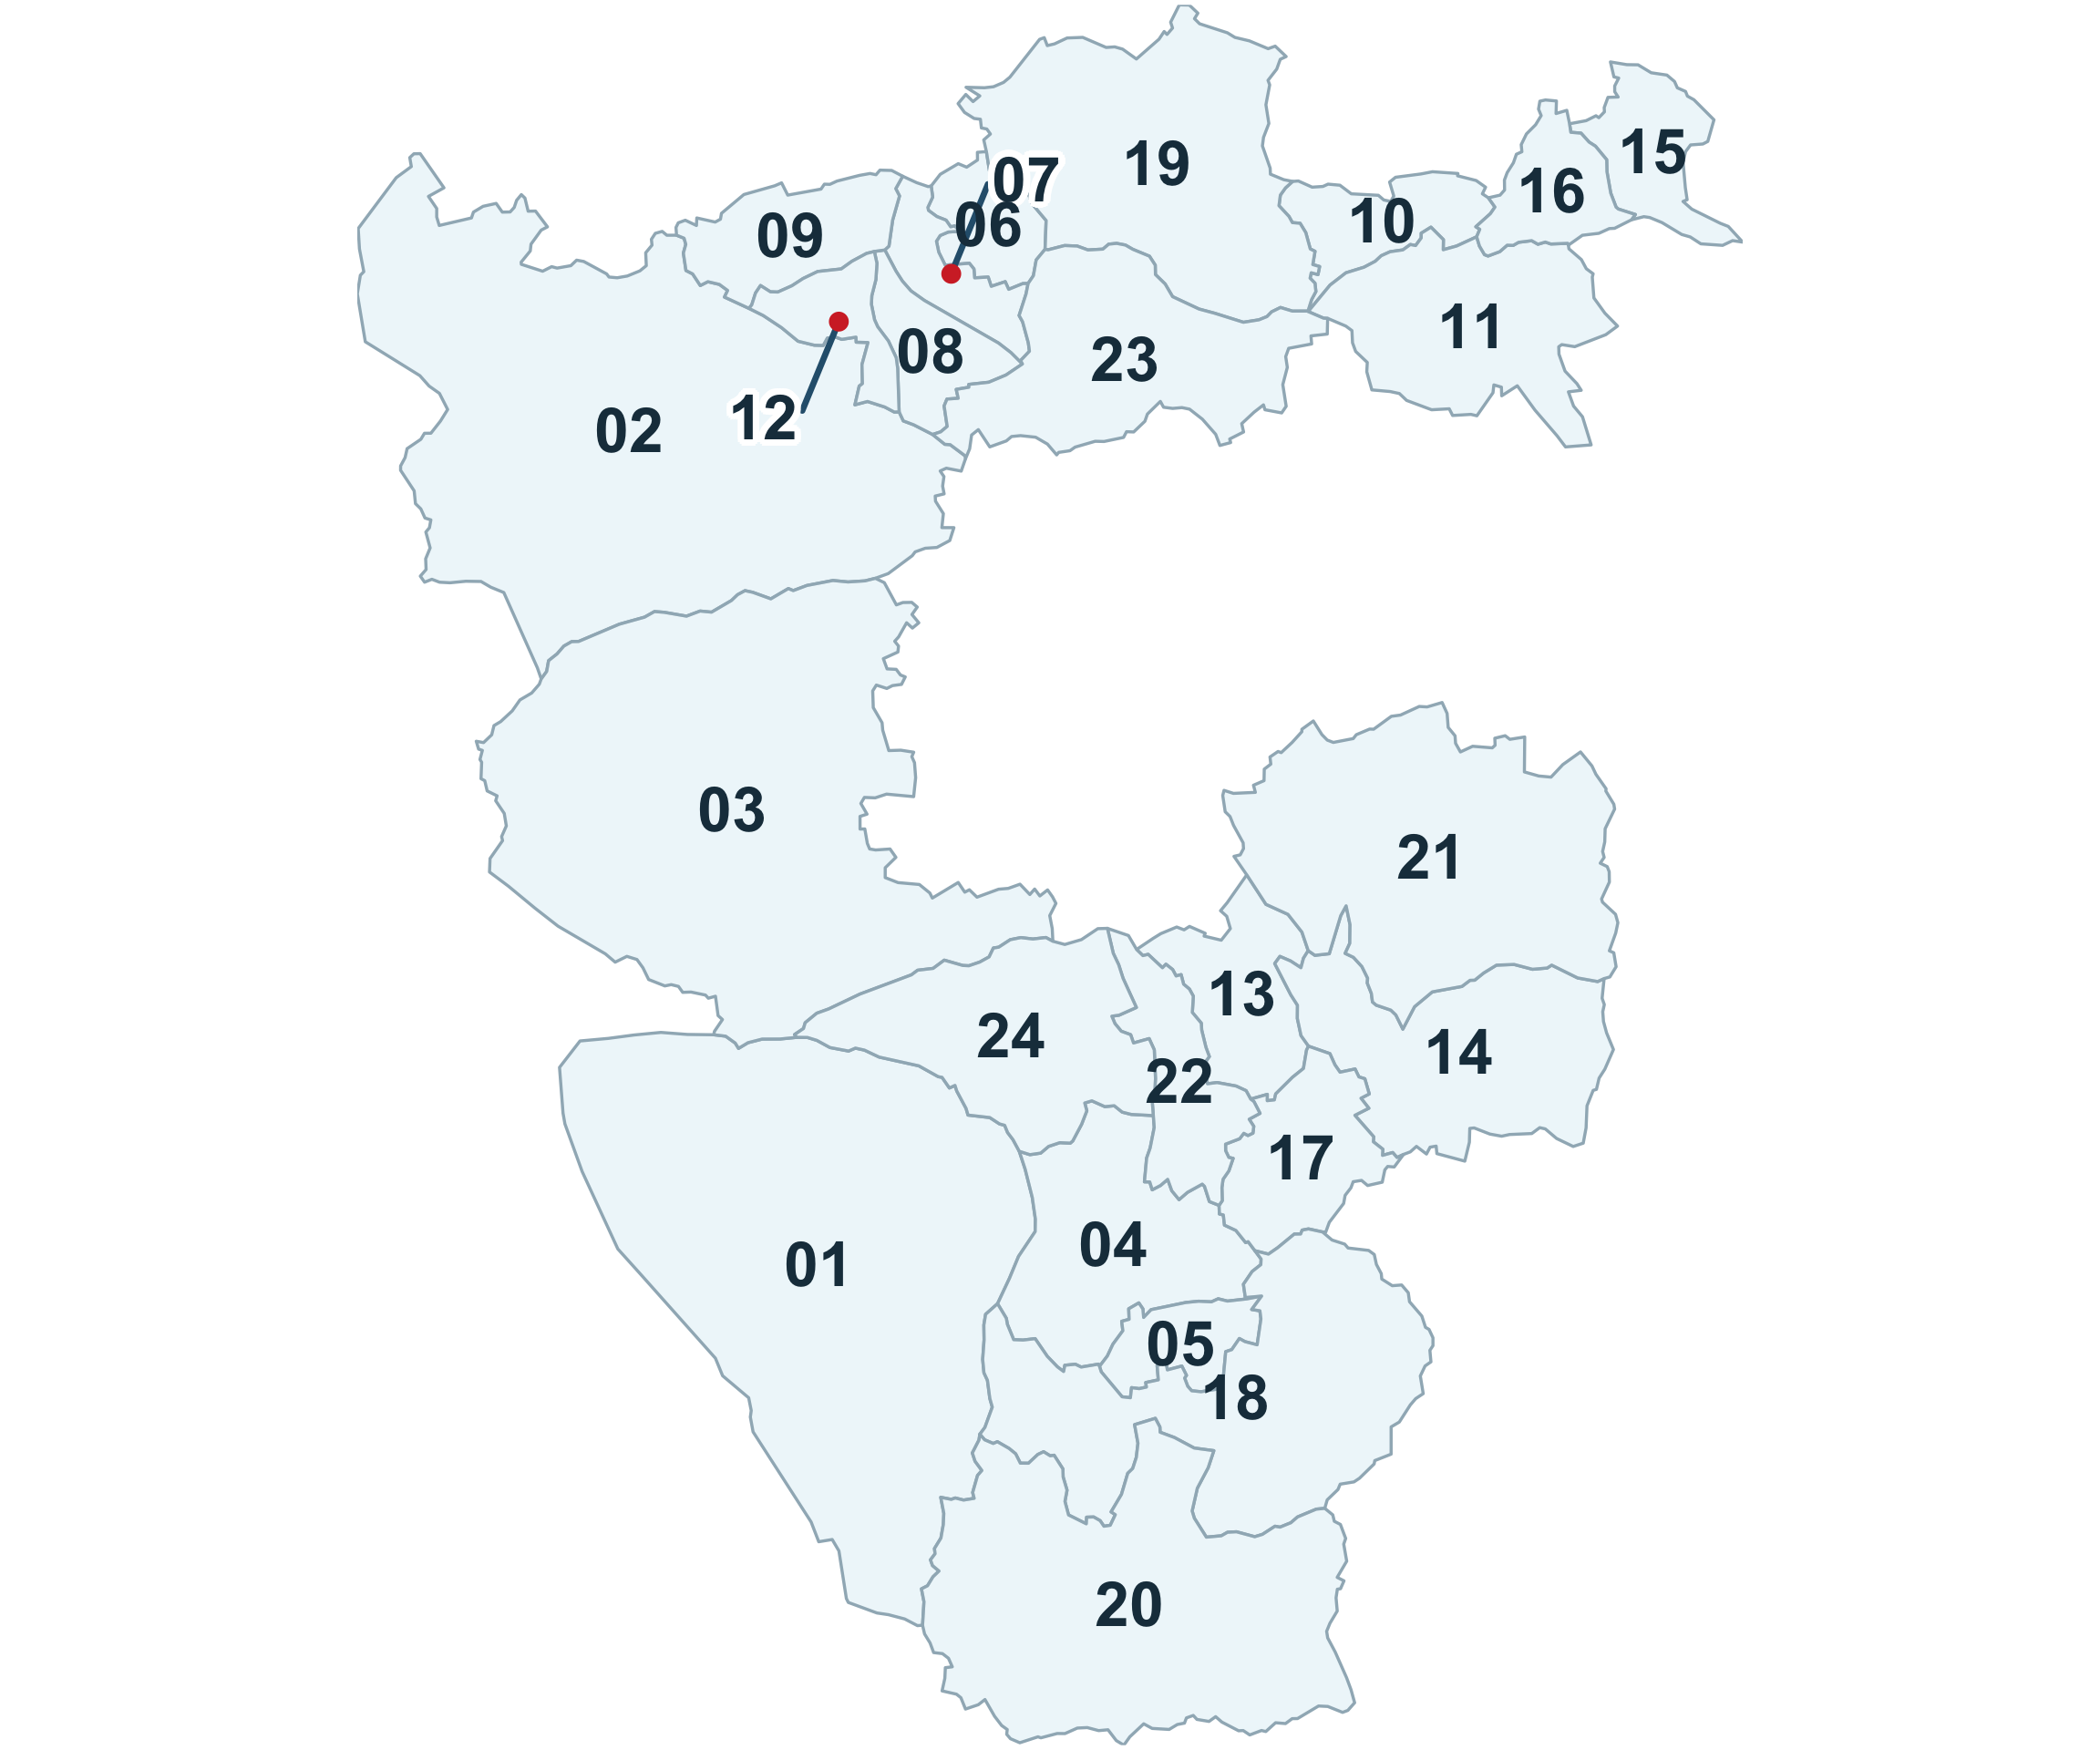
WARD REFERENCE
01: Ashover
02: Barlow & Holmesfield
03: Brampton & Walton
04: Clay Cross North
05: Clay Cross South
06: Coal Aston
07: Dronfield North
08: Dronfield South
09: Dronfield Woodhouse
10: Eckington North
11: Eckington South & Renishaw
12: Gosforth Valley
13: Grassmoor
14: Holmewood & Heath
15: Killamarsh East
16: Killamarsh West
17: North Wingfield Central
18: Pilsley & Morton
19: Ridgeway & Marsh Lane
20: Shirland
21: Sutton
22: Tupton
23: Unstone
24: Wingerworth
 Why is it important to Population Health?
Health inequalities are defined as unfair and avoidable differences in health outcomes between different groups of people or populations - such as differences in how long we live, the age at which we get preventable diseases or health conditions. The health & wellbeing of our population, and these disparities, are influenced by the wider (social) determinants of health which encompass a diverse range of social, economic and environmental factors such as housing, income, education, amenities, social networks and the environment where people are born, live, work and age. These factors can impact positively or negatively upon a person’s health outcomes, lifestyle choices and their quality and quantity of life (life expectancy). These inequalities contribute to preventable ill health and premature mortality.
Identifying the gaps and addressing these disparities is critical to improving population health and reducing the gap in life expectancy and healthy life expectancy between different communities.
The Area Health Profile (2023) highlights that North East Derbyshire has a higher proportion of older people and a smaller proportion of younger people, compared to the England average, yet appears more similar in comparison to the Derbyshire average.
Alongside the ageing population, the district (when compared to the Derbyshire average) has higher rates of people receiving long-term support in the community, unpaid care provision and limited day-to-day activities.1
The data for male life expectancy at birth (80.4 years), is better than the Derbyshire & England average. The female life expectancy at birth (84.0 years), is similar to the Derbyshire & England average.2
Even though life expectancy figures are good, the above indicates people are more likely to be living in poorer health and with long term conditions. This potentially impacts upon people’s quality of life (healthy life expectancy). and accessibility to amenities, opportunities and services to support their health and wellbeing. In turn, poorer health increases the likelihood of needing support or healthcare services, which have limited resource and are in high demand. This further supports the need for more preventative approaches, collaborative working and joined up person centred services in communities, that are more easily accessible for people locally.
The North East Derbyshire Public Health Outcomes Framework3 highlights the following indicators, which are significantly worse than the England average:
- Children in absolute low-income families (under 16s)
- Children in relative low-income families (under 16s)
- The rate of complaints about noise (All ages)
- Percentage of adults meeting the ‘5-a-day’ fruit and vegetable consumption recommendations (new method) (16+ yrs)
- Overweight (including obesity) prevalence in adults, (using adjusted self-reported height and weight) (18+ yrs)
- Admission episodes for alcohol-related conditions (Narrow) (All ages – Female)
- Percentage reporting a long-term Musculoskeletal (MSK) (16yrs+)
- Chlamydia detection rate per 100,000 aged 15 to 24 yrs (Female)
- HIV late diagnosis in people first diagnosed with HIV in the UK (15yrs+ - Persons)
- Emergency readmissions within 30 days of discharge from hospital
- Estimated dementia diagnosis rate (aged 65 and older)
Addressing priority areas identified by data sources at a locality level allows for partnership working to target resources and maximise reach to the populations with the greatest need. This involves using evidence-based practice to shape action to improve health outcomes and reduce health inequalities.
 The Derbyshire Population Health Approach
The Derbyshire Population Health Approach focuses on prevention, population health, evidence-informed practices, causes, and collaboration. It emphasises proactive measures to prevent health issues, tailors interventions to specific populations, incorporates evidence-informed practices, addresses underlying causes, and promotes collaboration for effective action.
When considering North East Derbyshire within The Derbyshire Population Health Approach:
• Prevention
The Healthy North East Derbyshire Partnership4 brings local partners together on a shared mission: to improve health and wellbeing and tackle inequalities across our communities. By taking a place-based and community-driven approach, we create opportunities for collaboration that make a real difference.
Our vision is simple yet powerful — to build the foundations for happy, healthy, and fulfilling lives. The Partnership works closely with communities, focusing on prevention and strengthening the building blocks of good health. Through collective action, we aim to create environments where individuals, families, and communities can thrive.
The Healthy North East Partnership is guided by the Derbyshire Health and Wellbeing board strategic priorities which are to:
- Tackle the 4 main risk factors that lead to poor health (Smoking, alcohol use, poor diet and physical inactivity are all key risk factors which lead to preventable ill health and premature mortality).
- Support good mental health.
- Support communities to be resilient and independent.
- Tackle child poverty and enable children and young people in Derbyshire to start well
- Develop the Healthy North East Partnership to deliver on the areas of focus
The Healthy North East Partnership is working collaboratively with local stakeholders, commissioned providers, and voluntary and community groups to refresh the five-year Locality Action Plan (2025–2029). This inclusive approach ensures the plan reflects the latest evidence and community priorities, with annual reviews to keep it relevant and responsive.
Grounded in recent health data, the Index of Multiple Deprivation (IMD), and census insights, the plan sets out six key priorities to improve health and reduce inequalities:
- Ensuring the best start for children and young people
- Improve mental health and wellbeing
- Promote healthy lifestyles
- Support for older people
- Build healthy resilient communities
- Financial and digital inclusion
Together, these priorities aim to create lasting change by focusing on prevention, equity, and community assets and strengths.
Working alongside partners to deliver a range of targeted programmes across North East, current work includes:
Mental Health and Suicide Prevention
Public Health and Mental Health & Suicide Prevention teams work together to raise awareness, share vital resources, and connect people to support. Through targeted campaigns and community engagement, they promote mental wellbeing and reduce stigma—attending local events, partnering with organisations, and spreading key messages across the district.
They champion initiatives like ‘5 Ways to Wellbeing’, ‘Baton of Hope’, and ‘Let’s Chat’, which make support visible and accessible through creative tools such as key rings, bench plaques, bus stop signs, and an interactive map highlighting calming outdoor spaces. Residents can also access specialist groups, including Perinatal Mental Health Support and Neurodivergent peer networks.
The Healthy North East Partnership also works with Thrive Social Prescribing, connecting young people (14–18) and young adults (up to 25) to non-clinical activities, education, training, and volunteering—helping them build confidence, resilience, and a sense of belonging.
Active Communities for Health and Wellbeing
North East Derbyshire District Council’s Health and Wellbeing Team champions physical activity through a wide range of local opportunities. The three newly renovated leisure centres—plus the brand-new Clay Cross Active facility (formerly Sharley Park Leisure Centre)—offer modern fitness spaces, mind-body workouts, healthy lifestyle programmes, and welcoming community areas like cafés and multipurpose spaces.
Beyond leisure centres, the district benefits from a rich network of partners including Falls Prevention Service, Live Life Better Derbyshire, Rykneld Homes, and local businesses and volunteers. Together, they deliver diverse activities such as chair-based exercise, yoga, Live Stronger for Longer classes, Octago, Kurling, and relaxation sessions—ensuring something for every age and ability.
The Walking Into Communities (WICO) project brings people together through hyper-local walking groups led by trained volunteers. These walks not only boost physical activity but also reduce isolation, helping residents feel connected and supported within their communities.
Social connection and reducing loneliness
This initiative sparks community-led action by offering micro-grants, mentoring, and confidence-building workshops—turning everyday ideas into meaningful opportunities for connection. Alongside funding, there is a vibrant community hub, informal social events, and practical training to empower residents. The goal? To create inclusive, welcoming spaces where people feel a sense of belonging and wellbeing can thrive.
Healthy Ageing
The Healthy North East Derbyshire Partnership has launched a dedicated subgroup to unite local partners around the healthy ageing agenda. Our work targets people aged 50 and over, with a strong emphasis on prevention and early intervention. By aligning messaging, campaigns, and interventions, we aim to create a consistent approach that strengthens collaboration across the system and supports healthier ageing for our communities.
• Population
North East Derbyshire has a population of approximately 105,000 (in 2023), with people aged 16-64 years being the highest percentage of the population (59%) and the lowest aged 0-15 years (17% of the population).5
According to the census (2021) data:
- The population has increased by 3.0%, from around 99,000 in 2011 to 102,000 in 2021.
- The number of people aged 65 years and over increased by 20.9%.
- The number of people aged 15-64 years decreased by 3.5%.
- The number of children aged under 15 years increased by 4.1%.
- 20.2% of the North East Derbyshire population are aged 20 years & under (compared to 20.8% in Derbyshire & 23.1% in England).
- Over half (55%) of the population in North East Derbyshire were aged 21 to 64 years, (which is similar to the Derbyshire & England average).
- North East Derbyshire has the second highest population of people aged 65 years and over in the whole of Derbyshire (24.8% of the population)6
Evidence suggests that those populations in the most deprived areas have worse health and wellbeing outcomes than those in the least deprived areas, which contributes to health inequalities. North East Derbyshire (NED) has some areas experiencing significantly high levels of deprivation (as highlighted above), amongst the most disadvantaged communities in England.
One of the largest towns in North East Derbyshire District is Clay Cross which sits within the 20% most deprived areas in England (IMD overall Data).This area contains a considerable amount of North East Derbyshire’s population and footfall and is a key area of focus for partners locally. The town is undergoing significant regeneration following Towns Fund investment and has a large newly built housing development.
According to the Public Health Outcomes Framework Summary (May 2025) the Children in absolute low-income families (under 16s) & Children in relative low income families (under 16s) are significantly worse compared to the England average (in 2022/23). However, the Children in low income families (all dependent children under 20) is significantly better than the England average in 2016.7 There is a Financial Inclusion Group for partners across Chesterfield, North East Derbyshire and Bolsover, working in collaboration across the financial inclusion agenda.
• Evidence
The public health approach implements evidence-based practice, using research and data analysis to inform decisions, develop interventions, guide policies and influence change. A mixed method approach can be valuable at a locality level to gain context, lived experience, identify local priorities and shape shared goals to develop action and effective interventions locally. This involves combining both quantitative and qualitative data sources (i.e. public health outcomes framework and local insight gathering) to develop a deeper understanding of local needs, identify gaps and priorities and aligning interventions with local and national strategies.
Local data is analysed, and partners are consulted to identify the priorities for the Healthy North East Derbyshire Partnership Plan which aims to build, promote and support the health and wellbeing of local people within North East Derbyshire. This involves working in collaboration with stakeholders across the statutory, community and voluntary sectors focusing upon prevention and addressing the wider determinants of health.
This approach aims to reduce health inequalities and improve the health and wellbeing of North East Derbyshire residents, developing new initiatives, joining up and maximising resource, supporting and empowering local communities, and in turn reducing the increasing costs and demand on services. The multi-agency partnership approach and local delivery across sectors enables a wide range of interventions to meet the diverse needs of local people and communities across the life course.
• Causes
There are many causes and factors that influence peoples physical and mental health & wellbeing and contribute to poor health. These include social and economic factors, physical environment, individual lifestyle behaviours, access to amenities and health care.
These factors are often known as the ‘causes of the cause’ and the wider or social determinants of health. Addressing and understanding these underlying route causes and determinants, (i.e. housing, income, employment and education) are key to improving population health and wellbeing, tackling health inequalities and supporting people to live happier and healthier lives.
The Derbyshire Joint Health and Wellbeing Strategy (2024-2027)8 focuses on five areas to improve health and highlights four main risk factors to tackle that lead to poor health (which are smoking, physical inactivity, diet and alcohol) to reduce harm and preventable mortality. These are the main areas and services delivered by Live Life Better Derbyshire, Derbyshire County Council Public Health to improve population health.
• Collaboration
Working in partnership across different sectors is essential in delivering a population health approach at a locality level. This involves a range of voluntary, community and statutory partners and organisations with a shared commitment to work collaboratively to improve health outcomes is key, and includes the NHS, health and care providers, local communities, community interest companies, voluntary sector, police, fire and rescue, community safety, local authorities, and public health teams.
It is important to work together to develop a shared vision and purpose between partners and across sectors to foster trusted relationships recognising the varied skills, knowledge and expertise of partners and communities. This has enabled many successful projects across the district (maximising assets and resource). Working collaboratively at both a locality and strategic level across the district has enabled us to address the wider determinants of health, reduce health inequalities and improve health outcomes.
There are various strategic partnerships within North East Derbyshire which include a range of cross sector partners. These include the Place Alliance, Community Safety Partnership, and the Healthy North East Derbyshire Partnership. These partnerships share specific priorities, identify assets and gaps, and furthermore they drive work forward to improve the health and wellbeing of the population and feed into the Health and Wellbeing Board and Integrated Care Board. The numerous thematic subgroups and local partnership groups within the locality area(s) enable collaboration and action on specific local priorities and areas of focus include:
- Financial Inclusion Group (Chesterfield & NED)
- Healthy Ageing NED subgroup
- Clay Cross Healthy Futures Group
- Active Neighbourhood Pilot
- Dronfield 2gether Network
- Community Hubs Network
- Social Connectedness Action Group
- Voluntary Sector Forum
These partnerships are invaluable and instigate collaborative action, shared priorities, connect partners and avoid duplication. They are built on open and trusting relationships, distributed leadership, shared learning and knowledge, combined expertise and resource.
 Latest Derbyshire Data
| Population in each IMD Decile by Area (count) | |||||||||||
| Area | 1 - Most deprived | 2 | 3 | 4 | 5 | 6 | 7 | 8 | 9 | 10 - Least deprived | Total |
|---|---|---|---|---|---|---|---|---|---|---|---|
| Derby | 57301 | 45294 | 24928 | 17295 | 22316 | 20465 | 7866 | 17904 | 18804 | 31447 | 263620 |
| Derbyshire | 42201 | 71195 | 80125 | 92050 | 91080 | 70384 | 105556 | 94952 | 84076 | 71836 | 803455 |
| Amber Valley | 5043 | 12740 | 5635 | 17589 | 21197 | 6329 | 15897 | 19090 | 12087 | 11327 | 126934 |
| Bolsover | 4726 | 14880 | 7410 | 21103 | 13929 | 4155 | 7774 | 5976 | 1588 | 0 | 81541 |
| Chesterfield | 12280 | 13362 | 24337 | 12221 | 2668 | 10375 | 10834 | 3027 | 5199 | 9801 | 104104 |
| Derbyshire Dales | 1533 | 0 | 0 | 4696 | 6772 | 14226 | 16350 | 16920 | 10207 | 1051 | 71755 |
| Erewash | 8990 | 12594 | 13767 | 6482 | 11797 | 9358 | 12235 | 12184 | 17110 | 8556 | 113073 |
| High Peak | 4162 | 4226 | 7878 | 7024 | 12903 | 10094 | 15338 | 17539 | 1233 | 10709 | 91106 |
| North East Derbyshire | 3968 | 9515 | 13444 | 10459 | 11240 | 10690 | 11304 | 5780 | 11672 | 15725 | 103797 |
| South Derbyshire | 1499 | 3878 | 7654 | 12476 | 10574 | 5157 | 15824 | 14436 | 24980 | 14667 | 111145 |
| Source: Ministry of Housing, Communities and Local Government IMD 2025, ONS LSOA mid-year population estimates 2022 | |||||||||||
| Population in each IMD Decile by Area (percentage) | |||||||||||
| Area | 1 - Most deprived | 2 | 3 | 4 | 5 | 6 | 7 | 8 | 9 | 10 - Least deprived | Total |
|---|---|---|---|---|---|---|---|---|---|---|---|
| Derby | 21.7% | 17.2% | 9.5% | 6.6% | 8.5% | 7.8% | 3% | 6.8% | 7.1% | 11.9% | 263620 |
| Derbyshire | 5.3% | 8.9% | 10% | 11.5% | 11.3% | 8.8% | 13.1% | 11.8% | 10.5% | 8.9% | 803455 |
| Amber Valley | 4% | 10% | 4.4% | 13.9% | 16.7% | 5% | 12.5% | 15% | 9.5% | 8.9% | 126934 |
| Bolsover | 5.8% | 18.2% | 9.1% | 25.9% | 17.1% | 5.1% | 9.5% | 7.3% | 1.9% | 0 | 81541 |
| Chesterfield | 11.8% | 12.8% | 23.4% | 11.7% | 2.6% | 10% | 10.4% | 2.9% | 5% | 9.4% | 104104 |
| Derbyshire Dales | 2.1% | 0 | 0 | 6.5% | 9.4% | 19.8% | 22.8% | 23.6% | 14.2% | 1.5% | 71755 |
| Erewash | 8% | 11.1% | 12.2% | 5.7% | 10.4% | 8.3% | 10.8% | 10.8% | 15.1% | 7.6% | 113073 |
| High Peak | 4.6% | 4.6% | 8.6% | 7.7% | 14.2% | 11.1% | 16.8% | 19.3% | 1.4% | 11.8% | 91106 |
| North East Derbyshire | 3.8% | 9.2% | 13% | 10.1% | 10.8% | 10.3% | 10.9% | 5.6% | 11.2% | 15.1% | 103797 |
| South Derbyshire | 1.3% | 3.5% | 6.9% | 11.2% | 9.5% | 4.6% | 14.2% | 13% | 22.5% | 13.2% | 111145 |
| Source: Ministry of Housing, Communities and Local Government IMD 2025, ONS LSOA mid-year population estimates 2022 | |||||||||||
| Population by Ethnicity (percentage) | |||||
| Area | Asian, Asian British or Asian Welsh | Black, Black British, Black Welsh, Caribbean or African | Mixed or Multiple ethnic groups | White | Other ethnic group |
|---|---|---|---|---|---|
| England | 9.6 | 4.2 | 3.0 | 81.0 | 2.2 |
| Derby | 15.6 | 4.0 | 3.7 | 73.8 | 2.9 |
| Derbyshire | 1.5 | 0.5 | 1.4 | 96.3 | 0.3 |
| Amber Valley | 1.0 | 0.3 | 1.2 | 97.3 | 0.2 |
| Bolsover | 0.9 | 0.5 | 0.9 | 97.4 | 0.3 |
| Chesterfield | 1.9 | 0.8 | 1.4 | 95.5 | 0.4 |
| Derbyshire Dales | 0.7 | 0.2 | 1.0 | 97.8 | 0.3 |
| Erewash | 1.6 | 0.8 | 1.8 | 95.4 | 0.4 |
| High Peak | 0.8 | 0.2 | 1.3 | 97.4 | 0.2 |
| North East Derbyshire | 0.9 | 0.3 | 1.1 | 97.4 | 0.2 |
| South Derbyshire | 3.6 | 0.8 | 1.8 | 93.1 | 0.7 |
| Source: Census 2021 | |||||
Trend Data
The following charts show life expectancy over time in Derbyshire by district and sex (compared to England)
PHOF Profile
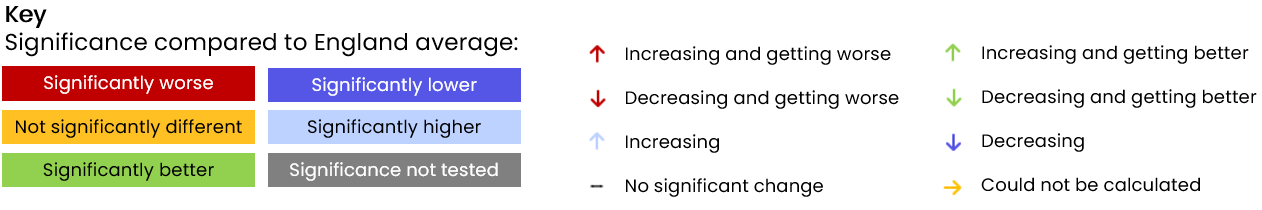
Notes:
- For indicators that aren’t straightforward to determine whether a high value is good or bad are shaded in blue rather than red/amber/green.
- Recent trend refers to analysis done by Fingertips which tests for a statistical trend. Please see the Fingertips tool for full details.
- Increases and decreases are only shown if they are statistically significant.
| A. Overarching indicators | ||||||||
| Indicator | Age | Sex | Period | Value | East Midlands region | England | Unit | Recent Trend |
|---|---|---|---|---|---|---|---|---|
| A01b - Life expectancy at 65 | 65 | Female | 2024 | 21.2 | 21.3 | 21.6 | Years | |
| A01b - Life expectancy at 65 | 65 | Female | 2022 - 24 | 21.0 | 21.0 | 21.4 | Years | |
| A01b - Life expectancy at 65 | 65 | Male | 2024 | 18.8 | 18.9 | 19.2 | Years | |
| A01b - Life expectancy at 65 | 65 | Male | 2022 - 24 | 18.9 | 18.7 | 18.9 | Years | |
| A01b - Life expectancy at birth | All ages | Female | 2024 | 83.1 | 83.1 | 83.6 | Years | |
| A01b - Life expectancy at birth | All ages | Female | 2022 - 24 | 83.3 | 82.8 | 83.3 | Years | |
| A01b - Life expectancy at birth | All ages | Male | 2024 | 79.6 | 79.3 | 79.8 | Years | |
| A01b - Life expectancy at birth | All ages | Male | 2022 - 24 | 79.9 | 79.0 | 79.5 | Years | |
| A02a - Inequality in life expectancy at 65 | 65 | Female | 2021 - 23 | 6.3 | 4.8 | 5.0 | Years | |
| A02a - Inequality in life expectancy at 65 | 65 | Male | 2021 - 23 | 5.1 | 5.3 | 5.6 | Years | |
| A02a - Inequality in life expectancy at birth | All ages | Female | 2021 - 23 | 9.3 | 7.9 | 8.3 | Years | |
| A02a - Inequality in life expectancy at birth | All ages | Male | 2021 - 23 | 7.9 | 10.1 | 10.5 | Years | |
| Source: OHID Fingertips | ||||||||
| B. Wider Determinants of Health | ||||||||
| Indicator | Age | Sex | Period | Value | East Midlands region | England | Unit | Recent Trend |
|---|---|---|---|---|---|---|---|---|
| 1.01i - Children in low income families (all dependent children under 20) | 0-19 yrs | Persons | 2016 | 14.9 | 16.3 | 17.0 | % | |
| B01b - Children in absolute low income families (under 16s) | <16 yrs | Persons | 2023/24 | 17.4 | 20.7 | 19.1 | % | |
| B01b - Children in relative low income families (under 16s) | <16 yrs | Persons | 2023/24 | 20.6 | 24.1 | 22.1 | % | |
| B03 - Pupil absence | 5-15 yrs | Persons | 2023/24 | 6.9 | 7.1 | 7.1 | % | |
| B08d - Percentage of people in employment | 16-64 yrs | Persons | 2024/25 | 75.4 | 74.9 | 75.7 | % | |
| B09a - Sickness absence: the percentage of employees who had at least one day off in the previous week | 16+ yrs | Persons | 2021 - 23 | 2.3 | 2.1 | 2.2 | % | |
| B09b - Sickness absence: the percentage of working days lost due to sickness absence | 16+ yrs | Persons | 2021 - 23 | 1.0 | 1.3 | 1.2 | % | |
| B12a - Violent crime - hospital admissions for violence (including sexual violence) | All ages | Persons | 2021/22 - 23/24 | 27.8 | 28.8 | 34.2 | per 100,000 | |
| B12b - Violent crime - violence offences per 1,000 population | All ages | Persons | 2024/25 | 23.5 | 29.7 | 31.4 | per 1,000 | |
| B12c - Violent crime - sexual offences per 1,000 population | All ages | Persons | 2024/25 | 2.0 | 3.2 | 3.1 | per 1,000 | |
| B13a - Reoffending levels: percentage of offenders who reoffend | All ages | Persons | 2022/23 | 20.0 | 27.6 | 26.2 | % | |
| B13b - Reoffending levels: average number of reoffences per reoffender | All ages | Persons | 2022/23 | 2.7 | 4.2 | 4.0 | per re-offender | |
| B14a - The rate of complaints about noise | All ages | Persons | 2023/24 | 6.9 | 5.3 | 5.9 | per 1,000 | |
| B14b - The percentage of the population exposed to road, rail and air transport noise of 65dB(A) or more, during the daytime | All ages | Persons | 2021 | 2.9 | 3.0 | 4.3 | % | |
| B14c - The percentage of the population exposed to road, rail and air transport noise of 55 dB(A) or more during the night-time | All ages | Persons | 2021 | 6.7 | 6.2 | 8.4 | % | |
| B15a - Homelessness: households owed a duty under the Homelessness Reduction Act | Not applicable | Not applicable | 2024/25 | 5.1 | 11.6 | 13.6 | per 1,000 | |
| B15c - Homelessness: households in temporary accommodation | Not applicable | Not applicable | 2024/25 | 0.4 | 2.0 | 5.2 | per 1,000 | |
| B17 - Fuel poverty (low income, low energy efficiency methodology) | Not applicable | Not applicable | 2023 | 11.8 | 11.7 | 11.4 | % | |
| Source: OHID Fingertips | ||||||||
| C. Health Improvement | ||||||||
| Indicator | Age | Sex | Period | Value | East Midlands region | England | Unit | Recent Trend |
|---|---|---|---|---|---|---|---|---|
| C01 - Total prescribed LARC excluding injections rate / 1,000 | All ages | Female | 2024 | 45.5 | 41.6 | 40.0 | per 1,000 | |
| C04 - Low birth weight of term babies | >=37 weeks gestational age at birth | Persons | 2024 | 2.4 | 2.8 | 3.0 | % | |
| C06 - Smoking status at time of delivery | All ages | Female | 2024/25 | 8.0 | 7.9 | 6.1 | % | |
| C09a - Reception prevalence of overweight (including obesity) | 4-5 yrs | Persons | 2024/25 | 22.7 | 23.7 | 23.5 | % | |
| C09b - Year 6 prevalence of overweight (including obesity) | 10-11 yrs | Persons | 2024/25 | 34.8 | 36.3 | 36.2 | % | |
| C10 - Percentage of physically active children and young people | 5-16 yrs | Persons | 2024/25 | NA | 48.9 | 49.1 | % | |
| C11a - Hospital admissions caused by unintentional and deliberate injuries in children (aged 0 to 14 years) | <15 yrs | Persons | 2023/24 | 58.4 | 54.9 | 72.7 | per 10,000 | |
| C11a - Hospital admissions caused by unintentional and deliberate injuries in children (aged 0 to 4 years) | 0-4 yrs | Persons | 2023/24 | 69.7 | 68.3 | 93.2 | per 10,000 | |
| C11b - Hospital admissions caused by unintentional and deliberate injuries in young people (aged 15 to 24 years) | 15-24 yrs | Persons | 2023/24 | 79.8 | 79.2 | 88.6 | per 10,000 | |
| C14b - Emergency Hospital Admissions for Intentional Self-Harm | All ages | Persons | 2023/24 | 108.8 | 128.1 | 117.0 | per 100,000 | |
| C15 - Percentage of adults meeting the '5-a-day' fruit and vegetable consumption recommendations (new method) | 16+ yrs | Persons | 2023/24 | 26.3 | 30.1 | 31.3 | % | |
| C15 - Proportion of the population meeting the recommended '5 a day' on a 'usual day' (adults) (old method) | 16+ yrs | Persons | 2019/20 | 58.0 | 55.0 | 55.4 | % | |
| C16 - Overweight (including obesity) prevalence in adults, (using adjusted self-reported height and weight) | 18+ yrs | Persons | 2023/24 | 70.3 | 67.1 | 64.5 | % | |
| C17a - Percentage of physically active adults | 19+ yrs | Persons | 2023/24 | 71.2 | 66.7 | 67.4 | % | |
| C17b - Percentage of physically inactive adults | 19+ yrs | Persons | 2023/24 | 19.0 | 22.7 | 22.0 | % | |
| C18 - Smoking Prevalence in adults (aged 18 and over) - current smokers (APS) | 18+ yrs | Persons | 2024 | 6.3 | 10.4 | 10.4 | % | |
| C18 - Smoking Prevalence in adults (aged 18 and over) - current smokers (APS) | 18+ yrs | Persons | 2022 - 24 | 7.6 | 11.6 | 10.9 | % | |
| C19d - Deaths from drug misuse | All ages | Persons | 2022 - 24 | 7.0 | 5.9 | 5.8 | per 100,000 | |
| C21 - Admission episodes for alcohol-related conditions (Narrow) | All ages | Female | 2023/24 | 492.0 | 396.8 | 339.5 | per 100,000 | |
| C21 - Admission episodes for alcohol-related conditions (Narrow) | All ages | Male | 2023/24 | 601.4 | 724.9 | 686.5 | per 100,000 | |
| C21 - Admission episodes for alcohol-related conditions (Narrow) | All ages | Persons | 2023/24 | 542.1 | 553.6 | 504.1 | per 100,000 | |
| C22 - Estimated diabetes diagnosis rate | 17+ yrs | Persons | 2018 | 87.1 | 84.6 | 78.0 | % | |
| C23 - Percentage of cancers diagnosed at stages 1 and 2 | All ages | Persons | 2022 | 57.2 | 55.2 | 56.8 | % | |
| C24a - Cancer screening coverage: breast cancer | 53-70 yrs | Female | 2025 | 81.3 | 71.9 | 71.7 | % | |
| C24b - Cancer screening coverage: cervical cancer (aged 25 to 49 years old) | 25-49 yrs | Female | 2024 | 78.5 | 68.2 | 66.1 | % | |
| C24c - Cancer screening coverage: cervical cancer (aged 50 to 64 years old) | 50-64 yrs | Female | 2024 | 80.3 | 75.8 | 74.3 | % | |
| C24d - Cancer screening coverage: bowel cancer | 60-74 yrs | Persons | 2025 | 77.7 | 74.2 | 72.9 | % | |
| C24e - Abdominal Aortic Aneurysm Screening Coverage | 65 | Male | 2024/25 | 89.3 | 86.3 | 82.2 | % | |
| C27 - Percentage reporting a long-term Musculoskeletal (MSK) problem | 16+ yrs | Persons | 2023 | 26.4 | 20.0 | 18.4 | % | |
| C28a - Self reported wellbeing: people with a low satisfaction score | 16+ yrs | Persons | 2022/23 | NA | 6.5 | 5.6 | % | |
| C28b - Self reported wellbeing: people with a low worthwhile score | 16+ yrs | Persons | 2022/23 | NA | 4.4 | 4.4 | % | |
| C28c - Self reported wellbeing: people with a low happiness score | 16+ yrs | Persons | 2022/23 | NA | 9.3 | 8.8 | % | |
| C28d - Self reported wellbeing: people with a high anxiety score | 16+ yrs | Persons | 2022/23 | 22.6 | 21.5 | 23.3 | % | |
| C29 - Emergency hospital admissions due to falls in people aged 65 and over | 65+ yrs | Persons | 2023/24 | 1,513.8 | 1,908.5 | 1,984.0 | per 100,000 | |
| C29 - Emergency hospital admissions due to falls in people aged 65 to 79 | 65-79 yrs | Persons | 2023/24 | 580.1 | 908.4 | 954.7 | per 100,000 | |
| C29 - Emergency hospital admissions due to falls in people aged 80 plus | 80+ yrs | Persons | 2023/24 | 4,221.6 | 4,808.6 | 4,968.9 | per 100,000 | |
| Source: OHID Fingertips | ||||||||
| D. Health Protection | ||||||||
| Indicator | Age | Sex | Period | Value | East Midlands region | England | Unit | Recent Trend |
|---|---|---|---|---|---|---|---|---|
| D01 - Air pollution: estimated fraction of mortality attributable to particulate air pollution | 30+ yrs | Persons | 2024 | 5.2 | 5.4 | 5.3 | % | |
| D02a - Chlamydia detection rate per 100,000 aged 15 to 24 years | 15-24 yrs | Female | 2024 | 1,981.7 | 1,775.4 | 1,589.4 | per 100,000 | |
| D02a - Chlamydia detection rate per 100,000 aged 15 to 24 years | 15-24 yrs | Male | 2024 | 723.4 | 908.7 | 837.2 | per 100,000 | |
| D02a - Chlamydia detection rate per 100,000 aged 15 to 24 years | 15-24 yrs | Persons | 2024 | 1,384.0 | 1,351.5 | 1,249.8 | per 100,000 | |
| D08a - Proportion of drug sensitive TB notifications who had completed a full course of treatment by 12 months | All ages | Persons | 2023 | NA | 79.2 | 84.4 | % | |
| D08b - TB incidence (three year average) | All ages | Persons | 2022 - 24 | 3.2 | 8.0 | 8.5 | per 100,000 | |
| D10 - Adjusted antibiotic prescribing in primary care by the NHS | All ages | Persons | 2024 | 1.0 | 0.9 | 0.9 | per STAR-PU | |
| Source: OHID Fingertips | ||||||||
| E. Healthcare and Premature Mortality | ||||||||
| Indicator | Age | Sex | Period | Value | East Midlands region | England | Unit | Recent Trend |
|---|---|---|---|---|---|---|---|---|
| E01 - Infant mortality rate | <1 yr | Persons | 2022 - 24 | 2.2 | 4.6 | 4.2 | per 1,000 | |
| E02 - Percentage of 5 year olds with experience of visually obvious dental decay | 5 yrs | Persons | 2023/24 | 15.2 | 21.5 | 22.4 | % | |
| E03 - Under 75 mortality rate from causes considered preventable | <75 yrs | Persons | 2024 | 156.4 | 158.3 | 145.8 | per 100,000 | |
| E03 - Under 75 mortality rate from causes considered preventable | <75 yrs | Persons | 2022 - 24 | 142.5 | 160.2 | 151.2 | per 100,000 | |
| E04a - Under 75 mortality rate from cardiovascular disease | <75 yrs | Persons | 2024 | 62.7 | 77.9 | 74.3 | per 100,000 | |
| E04a - Under 75 mortality rate from cardiovascular disease | <75 yrs | Persons | 2022 - 24 | 60.1 | 79.2 | 76.5 | per 100,000 | |
| E04b - Under 75 mortality rate from cardiovascular disease considered preventable | <75 yrs | Persons | 2022 - 24 | 24.5 | 32.2 | 30.2 | per 100,000 | |
| E05a - Under 75 mortality rate from cancer | <75 yrs | Persons | 2024 | 141.0 | 125.1 | 117.9 | per 100,000 | |
| E05a - Under 75 mortality rate from cancer | <75 yrs | Persons | 2022 - 24 | 122.1 | 125.6 | 120.3 | per 100,000 | |
| E05b - Under 75 mortality rate from cancer considered preventable | <75 yrs | Persons | 2022 - 24 | 47.9 | 51.1 | 48.6 | per 100,000 | |
| E06a - Under 75 mortality rate from liver disease | <75 yrs | Persons | 2024 | 21.4 | 22.6 | 20.1 | per 100,000 | |
| E06a - Under 75 mortality rate from liver disease | <75 yrs | Persons | 2022 - 24 | 19.3 | 23.0 | 21.1 | per 100,000 | |
| E06b - Under 75 mortality rate from liver disease considered preventable | <75 yrs | Persons | 2022 - 24 | 16.0 | 20.7 | 18.9 | per 100,000 | |
| E07a - Under 75 mortality rate from respiratory disease | <75 yrs | Persons | 2024 | 24.1 | 32.8 | 32.7 | per 100,000 | |
| E07a - Under 75 mortality rate from respiratory disease | <75 yrs | Persons | 2022 - 24 | 32.5 | 31.8 | 32.4 | per 100,000 | |
| E07b - Under 75 mortality rate from respiratory disease considered preventable | <75 yrs | Persons | 2022 - 24 | 19.5 | 19.4 | 19.3 | per 100,000 | |
| E08 - Mortality rate from a range of specified communicable diseases, including influenza | All ages | Persons | 2022 - 24 | 14.5 | 14.5 | 15.2 | per 100,000 | |
| E10 - Suicide rate | 10+ yrs | Persons | 2022 - 24 | 8.6 | 11.8 | 10.9 | per 100,000 | |
| E11 - Emergency readmissions within 30 days of discharge from hospital | All ages | Persons | 2024/25 | 20.5 | 15.1 | 14.7 | % | |
| E13 - Hip fractures in people aged 65 and over | 65+ yrs | Persons | 2023/24 | 427.7 | 556.0 | 547.1 | per 100,000 | |
| E13 - Hip fractures in people aged 65 to 79 | 65-79 yrs | Persons | 2023/24 | 139.5 | 240.7 | 237.8 | per 100,000 | |
| E13 - Hip fractures in people aged 80 and over | 80+ yrs | Persons | 2023/24 | 1,263.6 | 1,470.3 | 1,443.8 | per 100,000 | |
| E14 - Winter mortality index (age 85 plus) | 85+ yrs | Persons | Aug 2021 - Jul 2022 | −0.9 | 8.5 | 11.3 | % | |
| E14 - Winter mortality index | All ages | Persons | Aug 2021 - Jul 2022 | −3.1 | 6.5 | 8.1 | % | |
| E15 - Estimated dementia diagnosis rate (aged 65 and older) | 65+ yrs | Persons | 2025 | 58.7 | 67.8 | 65.6 | per 100 | |
| Source: OHID Fingertips | ||||||||
Prevalence Maps of Derbyshire
The maps below illustrate various geographies for Derbyshire. LSOAs and MSOAs are geographical divisions used for statistical purposes, allowing for more detailed analysis of local data. In these maps, you can explore various health indicators and data for Derbyshire, providing valuable insights into the area’s health and wellbeing.
Wards Data Not Available
Data for this geography is not yet available. Please check back later.
Districts Data Not Available
Data for this geography is not yet available. Please check back later.
 |
In the top right of the map, you’ll find the ‘Layer Control’ icon. This is an easy way to customise what you see on the map visualisation. Click the ‘Layer Control’ to choose which information is displayed on the map. Pick the indicator that interests you the most, and the map will transform accordingly. |
 Further Analysis & Assessments
Derbyshire Joint Strategic Needs Assessment (JSNA) involves a thorough examination of a specific health problem, exploring its causes, consequences, and underlying factors. It combines various data sources, collaboration with stakeholders, and rigorous analysis to generate insights for evidence-informed interventions and policy changes.
 More Information & Resources
Contributors
Louise Hall, Service Development Officer, North East Derbyshire