| Index of Multiple Deprivation | Value |
|---|---|
| Derbyshire Rank | 99 (out of 153, 1 is most deprived) |
| Derbyshire Score | 96 (out of 153, 1 is most deprived) |
| Compared to Statistical Neighbours | 4 (out of 16, 1 is most deprived) |
| Total LSOAs in Derbyshire | 499 |
| LSOAs in Most Deprived 10% | 28 |
| LSOAs in Most Deprived 20% | 72 |
| Areas with the Greatest Concentration of Deprivation | Chesterfield, Bolsover, and Erewash |
| Most deprived LSOAs in Derbyshire | Cotmanhay Hopewell Farm (Skeavingstons Ln), Ironville Riddings E (High St), Grangewood Birdholm (Milton Cr) |
Index of Multiple Deprivation 2025
English indices of deprivation 2025
IMD
IMD2025
Deprivation
Inequalities
Index of Multiple Deprivation
Derbyshire
 Introduction
The English Indices of Deprivation (IoD) are the government’s official set of measures that are released to assess different aspects of deprivation across England at a small area level. They include indicators that focus on specific areas of disadvantage, such as income deprivation affecting children and older people, and measures of access to essential services. This release of measures (Indices of Deprivation 2025 – IoD25) updates the 2019 version (IoD19)1.
The IoD25 uses 55 indicators, an increase from 39 in the IoD19. This includes 20 new indicators, 14 indicators that have been significantly modified and 21 that have been updated to more recent timepoints. Therefore, interpreting deprivation over time using IoD25 should be done with caution and should consider the changes in methodology from previous versions2.
The most widely used measure within IoD is the Index of Multiple Deprivation (IMD). IMD provides an overall picture of relative deprivation. Deprivation describes a lack of access to the resources, opportunities, and living conditions needed for a good quality of life, including income, employment, education, housing, health services, and a safe environment. IMD captures this by combining seven weighted domains (weighted as shown below)3:
 Why is it important to Population Health?
The domains within the IoD25 reflect wider determinants of health, which can be understood using the Dahlgren and Whitehead model. The model highlights that deprivation is not just about income but about the relationship between factors that shape health and wellbeing4.
![]()
The IoD25 measures deprivation in small areas across England called LSOAs (Lower-layer Super Output Areas). These are standard statistical areas designed to have similar population sizes. In IoD25, LSOAs are referred to as ‘small areas’ or ‘neighbourhoods’.
Within Derbyshire, there are 499 LSOAs. There is no fixed point where an area is classed as ‘deprived’. The measures within IoD25 show relative deprivation for small areas using multiple indicators. An area may rank as highly deprived, but not all residents experience deprivation and deprivation can occur in less deprived areas.
IoD25 provides ranks, which can be grouped into equal sized categories (either ten ‘deciles’ or five ‘quintiles’). The first decile is the most deprived 10%, and the tenth decile is the least deprived 10%. The first quintile is the most deprived 20% and the fifth quintile is the least deprived 20%5. Percentages are often used to described how deprived a neighbourhood is.
There are two supplementary indices that are subsets of the Income Deprivation domain. The Income Deprivation Affecting Children Index (IDACI) measures income deprivation specifically among children (aged 0-15 years old) in small areas in England and the Income Deprivation Affecting Older People Index (IDAOPI) measures income deprivation relating specifically to older people (aged 60 years and over) in small areas in England.
 The Derbyshire Population Health Approach
The Derbyshire Population Health Approach focuses on prevention, population health, evidence-informed practices, causes, and collaboration. It emphasises proactive measures to prevent health issues, tailors interventions to specific populations, incorporates evidence-informed practices, addresses underlying causes, and promotes collaboration for effective action.
When considering the topic of indices of deprivation within The Derbyshire Population Health Approach:
• Prevention
While IoD25 is a powerful tool, it is one part of a broader picture and should be used alongside local intelligence and qualitative insights to inform action.
The Core20PLUS5 aims to support the reduction of healthcare inequalities and provides a clear framework for action by identifying where efforts should be focused6:
Core20: The most deprived 20% of the population nationally, where health outcomes are consistently poorest.
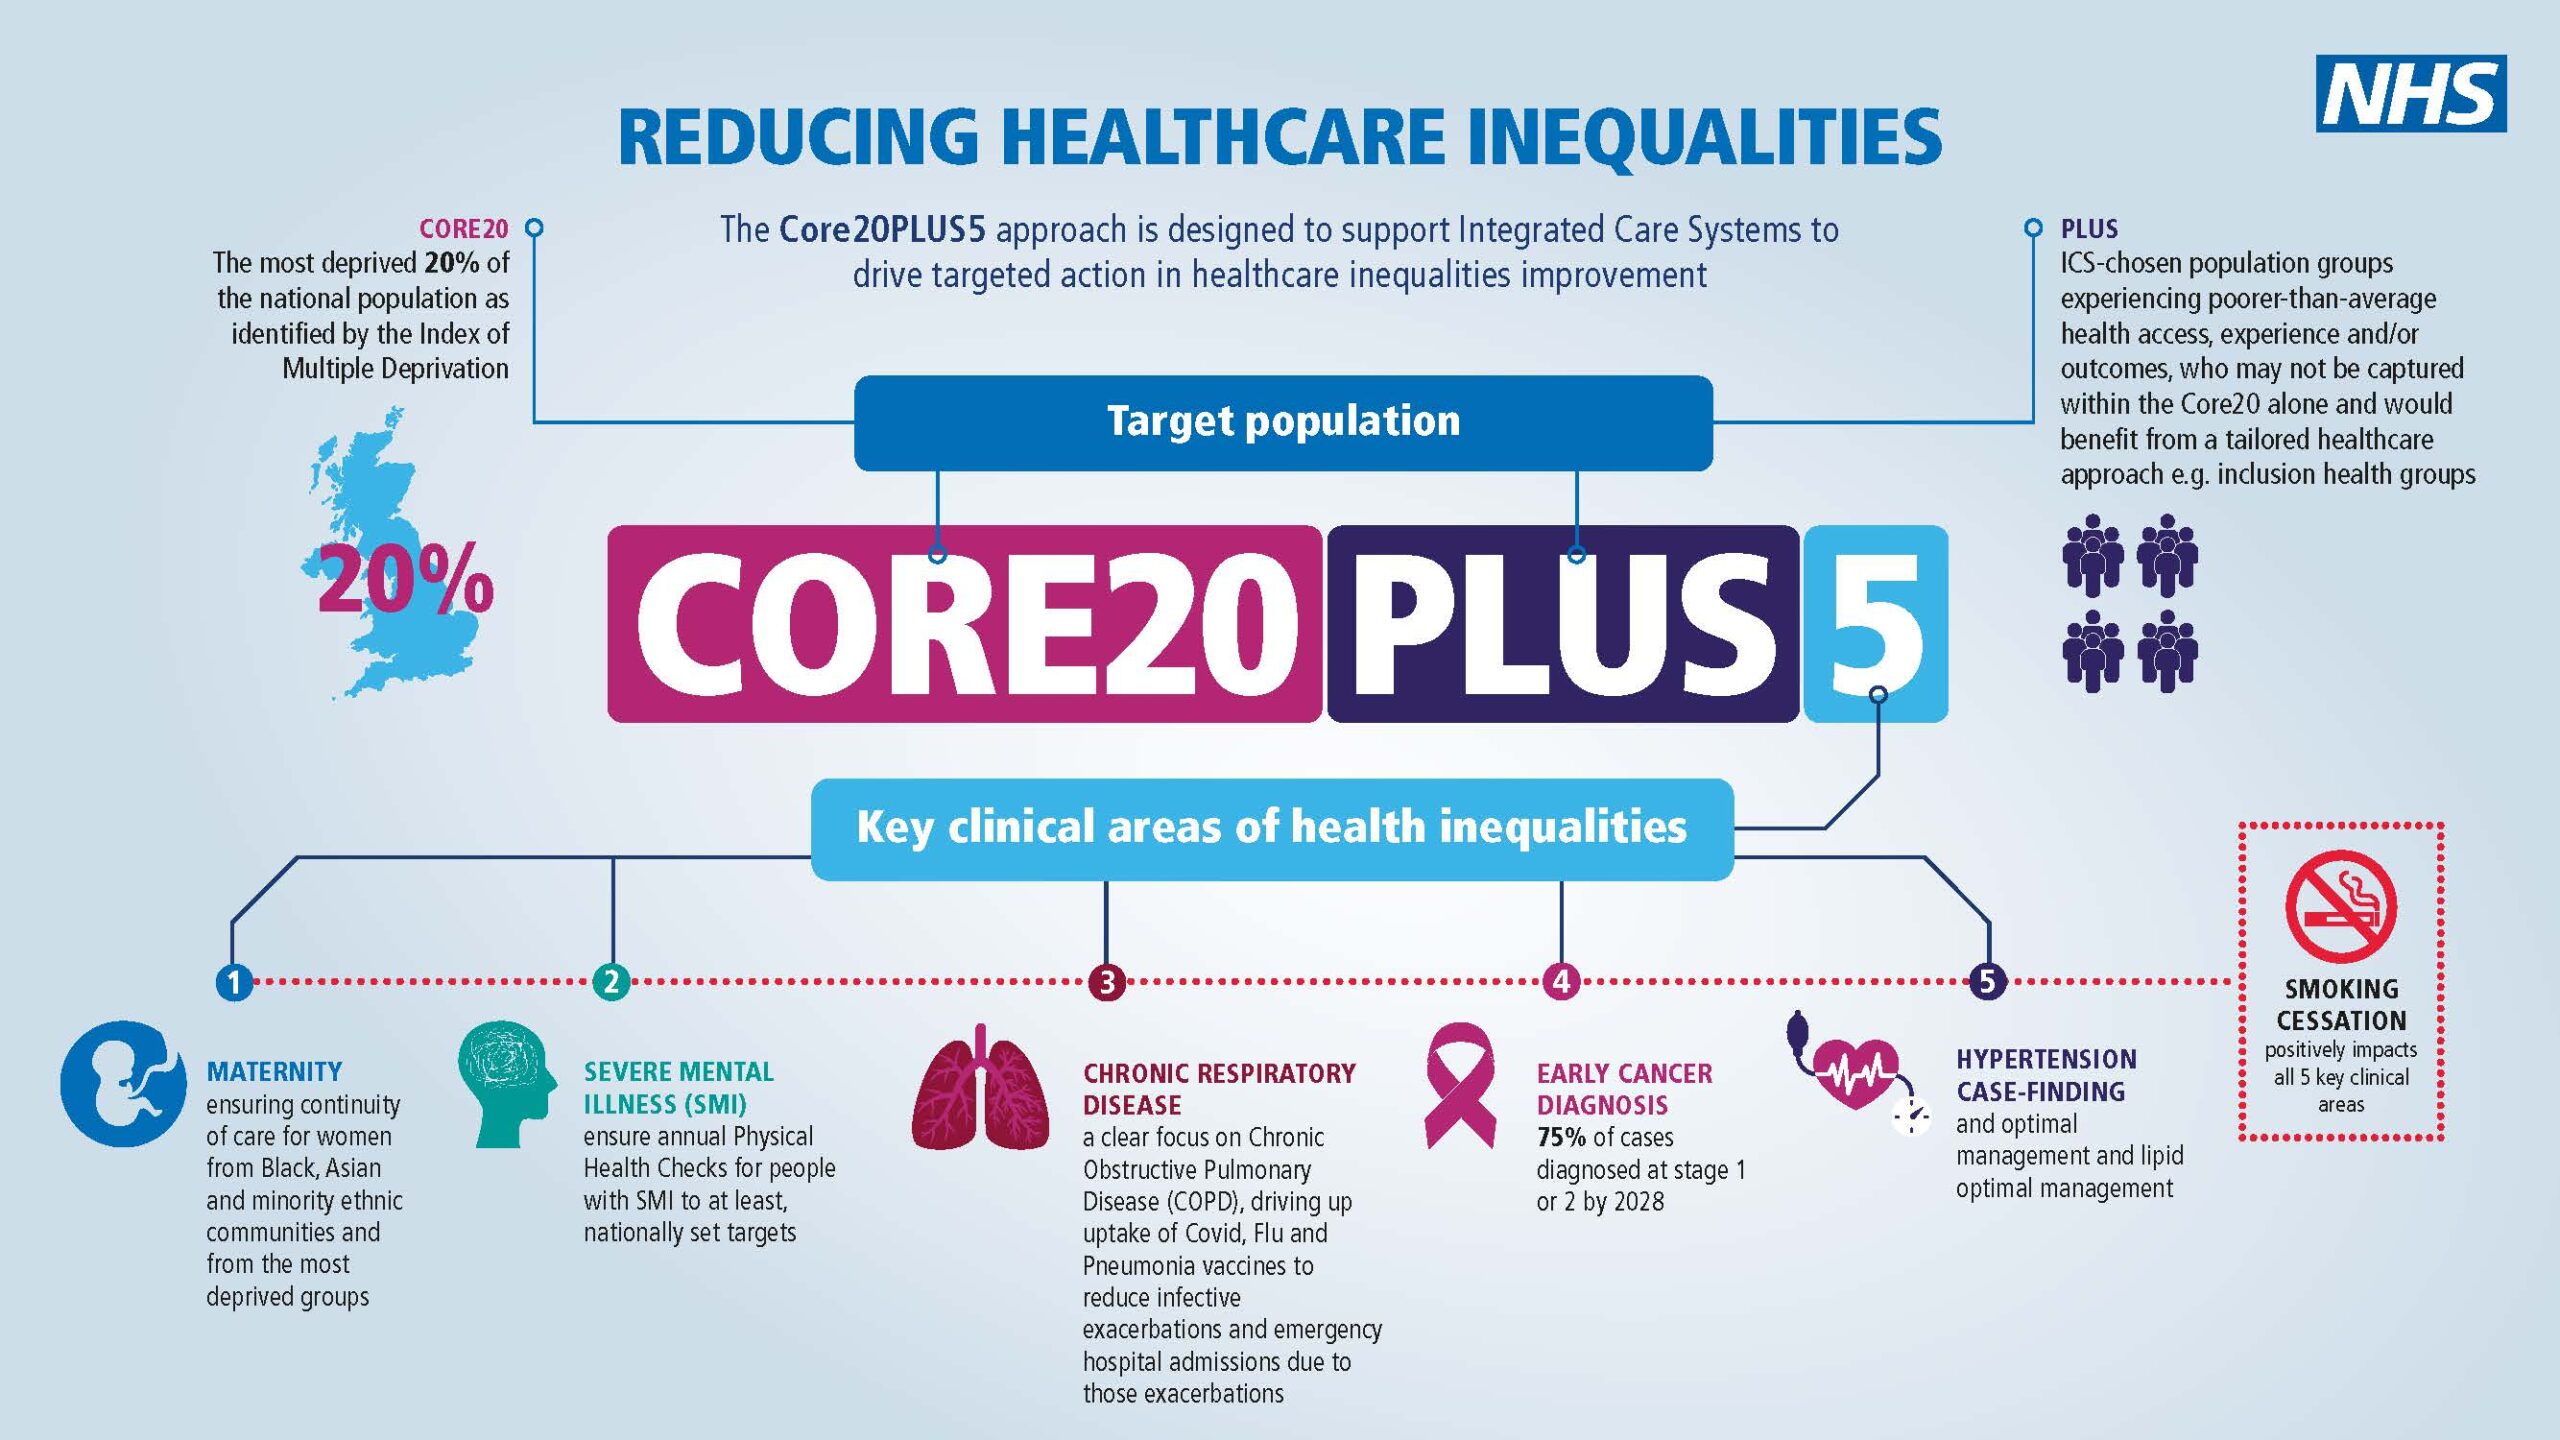
Understanding local deprivation patterns enables Derbyshire to align interventions with these priorities, ensuring resources are directed where they will have the greatest impact. Derbyshire is not among the most deprived local authorities overall, but it contains LSOAs in the most deprived quintile7:

When using IoD25 to contribute to evidence relating to public health interventions, the population the intervention is targeting should be considered. IoD25 includes supplementary indices such as the Income Deprivation Affecting Children Index (IDACI) and Income Deprivation Affecting Older People Index (IDAOPI) to allow deprivation to be assessed for specific populations. There is a standalone report released to investigate deprivation in rural areas across England (English indices of deprivation 2025: rural report)8. This is important to note as Derbyshire contains both urban and rural areas.
• Evidence
At a local level, the indices are frequently used to support strategy development, guide targeted interventions and strengthen funding bids. IoD25 is also valuable to the voluntary and community sector to help identify areas where their services can have the greatest impact. The indices are designed to offer a consistent, reliable and detailed measure of relative deprivation at a small area level across England.
• Causes
Deprivation refers to a broad lack of resources and is not just limited to finances and income. It is important to note that IoD25 combines seven domains of deprivation, reflecting unmet needs. When designing public health interventions, all domains within IoD25 should be considered due to the complex and interconnected nature of deprivation.
• Collaboration
It is important to work collaboratively and to use standardised measures of deprivation such as IoD25 to identify populations that are most affected by deprivation. Gaining public involvement to understand needs and how deprivation affects health outcomes can help reduce deprivation and health inequalities caused by deprivation. Collaboration is vital between stakeholders, partners, communities, the public, private and voluntary sectors to understand and reduce deprivation across Derbyshire.
 Latest Derbyshire Data
Decile by Population and Age
| IMD Decile by Area, total population | ||||||||||
| Area | 1 - Most deprived | 2 | 3 | 4 | 5 | 6 | 7 | 8 | 9 | 10 - Least deprived |
|---|---|---|---|---|---|---|---|---|---|---|
| Derby | 57301 (21.7%) | 45294 (17.2%) | 24928 (9.5%) | 17295 (6.6%) | 22316 (8.5%) | 20465 (7.8%) | 7866 (3%) | 17904 (6.8%) | 18804 (7.1%) | 31447 (11.9%) |
| Derbyshire | 42201 (5.3%) | 71195 (8.9%) | 80125 (10%) | 92050 (11.5%) | 91080 (11.3%) | 70384 (8.8%) | 105556 (13.1%) | 94952 (11.8%) | 84076 (10.5%) | 71836 (8.9%) |
| Amber Valley | 5043 (4%) | 12740 (10%) | 5635 (4.4%) | 17589 (13.9%) | 21197 (16.7%) | 6329 (5%) | 15897 (12.5%) | 19090 (15%) | 12087 (9.5%) | 11327 (8.9%) |
| Bolsover | 4726 (5.8%) | 14880 (18.2%) | 7410 (9.1%) | 21103 (25.9%) | 13929 (17.1%) | 4155 (5.1%) | 7774 (9.5%) | 5976 (7.3%) | 1588 (1.9%) | 0 |
| Chesterfield | 12280 (11.8%) | 13362 (12.8%) | 24337 (23.4%) | 12221 (11.7%) | 2668 (2.6%) | 10375 (10%) | 10834 (10.4%) | 3027 (2.9%) | 5199 (5%) | 9801 (9.4%) |
| Derbyshire Dales | 1533 (2.1%) | 0 | 0 | 4696 (6.5%) | 6772 (9.4%) | 14226 (19.8%) | 16350 (22.8%) | 16920 (23.6%) | 10207 (14.2%) | 1051 (1.5%) |
| Erewash | 8990 (8%) | 12594 (11.1%) | 13767 (12.2%) | 6482 (5.7%) | 11797 (10.4%) | 9358 (8.3%) | 12235 (10.8%) | 12184 (10.8%) | 17110 (15.1%) | 8556 (7.6%) |
| High Peak | 4162 (4.6%) | 4226 (4.6%) | 7878 (8.6%) | 7024 (7.7%) | 12903 (14.2%) | 10094 (11.1%) | 15338 (16.8%) | 17539 (19.3%) | 1233 (1.4%) | 10709 (11.8%) |
| North East Derbyshire | 3968 (3.8%) | 9515 (9.2%) | 13444 (13%) | 10459 (10.1%) | 11240 (10.8%) | 10690 (10.3%) | 11304 (10.9%) | 5780 (5.6%) | 11672 (11.2%) | 15725 (15.1%) |
| South Derbyshire | 1499 (1.3%) | 3878 (3.5%) | 7654 (6.9%) | 12476 (11.2%) | 10574 (9.5%) | 5157 (4.6%) | 15824 (14.2%) | 14436 (13%) | 24980 (22.5%) | 14667 (13.2%) |
| Source: Ministry of Housing, Communities and Local Government IMD 2025, ONS LSOA mid-year population estimates 2022 | ||||||||||
| IMD Decile by Area, Dependent Children aged 0-15 population | ||||||||||
| Area | 1 - Most deprived | 2 | 3 | 4 | 5 | 6 | 7 | 8 | 9 | 10 - Least deprived |
|---|---|---|---|---|---|---|---|---|---|---|
| Derby | 14586 (27.6%) | 8993 (17%) | 4936 (9.4%) | 2996 (5.7%) | 4268 (8.1%) | 3702 (7%) | 1356 (2.6%) | 3338 (6.3%) | 2963 (5.6%) | 5628 (10.7%) |
| Derbyshire | 9057 (6.7%) | 13598 (10%) | 14608 (10.8%) | 15656 (11.5%) | 15000 (11.1%) | 10932 (8.1%) | 16402 (12.1%) | 14855 (10.9%) | 13859 (10.2%) | 11777 (8.7%) |
| Amber Valley | 1154 (5.5%) | 2527 (11.9%) | 1022 (4.8%) | 2851 (13.5%) | 3418 (16.2%) | 1002 (4.7%) | 2333 (11%) | 2950 (13.9%) | 1773 (8.4%) | 2120 (10%) |
| Bolsover | 896 (6.4%) | 2942 (20.9%) | 1356 (9.7%) | 3685 (26.2%) | 2201 (15.7%) | 533 (3.8%) | 1348 (9.6%) | 867 (6.2%) | 222 (1.6%) | 0 |
| Chesterfield | 2706 (15.5%) | 2430 (13.9%) | 4176 (23.8%) | 2153 (12.3%) | 314 (1.8%) | 1440 (8.2%) | 1718 (9.8%) | 463 (2.6%) | 768 (4.4%) | 1343 (7.7%) |
| Derbyshire Dales | 337 (3.2%) | 0 | 0 | 809 (7.8%) | 1036 (10%) | 2017 (19.4%) | 2234 (21.5%) | 2302 (22.2%) | 1539 (14.8%) | 109 (1%) |
| Erewash | 1772 (9.2%) | 2268 (11.7%) | 2726 (14.1%) | 1207 (6.2%) | 1989 (10.3%) | 1461 (7.6%) | 1968 (10.2%) | 1930 (10%) | 2659 (13.8%) | 1334 (6.9%) |
| High Peak | 1092 (7.2%) | 596 (3.9%) | 1400 (9.2%) | 934 (6.1%) | 2332 (15.3%) | 1678 (11%) | 2343 (15.4%) | 2835 (18.6%) | 221 (1.5%) | 1776 (11.7%) |
| North East Derbyshire | 787 (4.6%) | 2069 (12%) | 2392 (13.9%) | 1713 (10%) | 1894 (11%) | 1723 (10%) | 1676 (9.8%) | 817 (4.8%) | 1765 (10.3%) | 2341 (13.6%) |
| South Derbyshire | 313 (1.5%) | 766 (3.7%) | 1536 (7.3%) | 2304 (11%) | 1816 (8.7%) | 1078 (5.1%) | 2782 (13.3%) | 2691 (12.8%) | 4912 (23.4%) | 2754 (13.1%) |
| Source: Ministry of Housing, Communities and Local Government IMD 2025, ONS LSOA mid-year population estimates 2022 | ||||||||||
| IMD Decile by Area, Population aged 16-59 | ||||||||||
| Area | 1 - Most deprived | 2 | 3 | 4 | 5 | 6 | 7 | 8 | 9 | 10 - Least deprived |
|---|---|---|---|---|---|---|---|---|---|---|
| Derby | 35801 (23.3%) | 28264 (18.4%) | 14458 (9.4%) | 10819 (7.1%) | 12865 (8.4%) | 11470 (7.5%) | 4209 (2.7%) | 9362 (6.1%) | 9720 (6.3%) | 16412 (10.7%) |
| Derbyshire | 23961 (5.5%) | 40290 (9.3%) | 45491 (10.5%) | 51055 (11.8%) | 49948 (11.5%) | 36466 (8.4%) | 55189 (12.8%) | 48813 (11.3%) | 44562 (10.3%) | 36784 (8.5%) |
| Amber Valley | 2934 (4.3%) | 7161 (10.5%) | 2953 (4.3%) | 9836 (14.5%) | 11789 (17.3%) | 3409 (5%) | 8015 (11.8%) | 9654 (14.2%) | 6146 (9%) | 6146 (9%) |
| Bolsover | 2775 (6.1%) | 8439 (18.6%) | 4086 (9%) | 11762 (25.9%) | 7607 (16.8%) | 2025 (4.5%) | 4406 (9.7%) | 3311 (7.3%) | 980 (2.2%) | 0 |
| Chesterfield | 7001 (12.4%) | 7519 (13.3%) | 14212 (25.1%) | 6765 (11.9%) | 1199 (2.1%) | 5261 (9.3%) | 6033 (10.7%) | 1591 (2.8%) | 2549 (4.5%) | 4491 (7.9%) |
| Derbyshire Dales | 861 (2.5%) | 0 | 0 | 2476 (7.1%) | 3452 (9.9%) | 6829 (19.5%) | 8025 (22.9%) | 7962 (22.8%) | 4924 (14.1%) | 467 (1.3%) |
| Erewash | 5057 (8.1%) | 7504 (12%) | 7885 (12.6%) | 3850 (6.1%) | 6803 (10.9%) | 4908 (7.8%) | 6505 (10.4%) | 6484 (10.3%) | 9263 (14.8%) | 4425 (7.1%) |
| High Peak | 2391 (4.9%) | 2321 (4.8%) | 4422 (9.1%) | 3784 (7.8%) | 7242 (14.9%) | 5457 (11.2%) | 7806 (16%) | 9052 (18.6%) | 661 (1.4%) | 5525 (11.4%) |
| North East Derbyshire | 2108 (3.9%) | 5233 (9.8%) | 7593 (14.2%) | 5638 (10.5%) | 6036 (11.3%) | 5685 (10.6%) | 5511 (10.3%) | 2866 (5.4%) | 5840 (10.9%) | 7021 (13.1%) |
| South Derbyshire | 834 (1.3%) | 2113 (3.4%) | 4340 (6.9%) | 6944 (11.1%) | 5820 (9.3%) | 2892 (4.6%) | 8888 (14.2%) | 7893 (12.6%) | 14199 (22.7%) | 8709 (13.9%) |
| Source: Ministry of Housing, Communities and Local Government IMD 2025, ONS LSOA mid-year population estimates 2022 | ||||||||||
| IMD Decile by Area, Older population aged 60 and over | ||||||||||
| Area | 1 - Most deprived | 2 | 3 | 4 | 5 | 6 | 7 | 8 | 9 | 10 - Least deprived |
|---|---|---|---|---|---|---|---|---|---|---|
| Derby | 6914 (12%) | 8037 (14%) | 5534 (9.6%) | 3480 (6.1%) | 5183 (9%) | 5293 (9.2%) | 2301 (4%) | 5204 (9.1%) | 6121 (10.7%) | 9407 (16.4%) |
| Derbyshire | 9183 (3.9%) | 17307 (7.4%) | 20026 (8.5%) | 25339 (10.8%) | 26132 (11.1%) | 22986 (9.8%) | 33965 (14.4%) | 31284 (13.3%) | 25655 (10.9%) | 23275 (9.9%) |
| Amber Valley | 955 (2.5%) | 3052 (8.1%) | 1660 (4.4%) | 4902 (13%) | 5990 (15.9%) | 1918 (5.1%) | 5549 (14.7%) | 6486 (17.2%) | 4168 (11%) | 3061 (8.1%) |
| Bolsover | 1055 (4.8%) | 3499 (15.8%) | 1968 (8.9%) | 5656 (25.6%) | 4121 (18.6%) | 1597 (7.2%) | 2020 (9.1%) | 1798 (8.1%) | 386 (1.7%) | 0 |
| Chesterfield | 2573 (8.6%) | 3413 (11.4%) | 5949 (19.8%) | 3303 (11%) | 1155 (3.9%) | 3674 (12.3%) | 3083 (10.3%) | 973 (3.2%) | 1882 (6.3%) | 3967 (13.2%) |
| Derbyshire Dales | 335 (1.3%) | 0 | 0 | 1411 (5.3%) | 2284 (8.7%) | 5380 (20.4%) | 6091 (23.1%) | 6656 (25.2%) | 3744 (14.2%) | 475 (1.8%) |
| Erewash | 2161 (7%) | 2822 (9.1%) | 3156 (10.2%) | 1425 (4.6%) | 3005 (9.7%) | 2989 (9.6%) | 3762 (12.1%) | 3770 (12.1%) | 5188 (16.7%) | 2797 (9%) |
| High Peak | 679 (2.5%) | 1309 (4.8%) | 2056 (7.5%) | 2306 (8.5%) | 3329 (12.2%) | 2959 (10.9%) | 5189 (19.1%) | 5652 (20.8%) | 351 (1.3%) | 3408 (12.5%) |
| North East Derbyshire | 1073 (3.2%) | 2213 (6.7%) | 3459 (10.5%) | 3108 (9.4%) | 3310 (10%) | 3282 (9.9%) | 4117 (12.4%) | 2097 (6.3%) | 4067 (12.3%) | 6363 (19.2%) |
| South Derbyshire | 352 (1.3%) | 999 (3.6%) | 1778 (6.5%) | 3228 (11.7%) | 2938 (10.7%) | 1187 (4.3%) | 4154 (15.1%) | 3852 (14%) | 5869 (21.3%) | 3204 (11.6%) |
| Source: Ministry of Housing, Communities and Local Government IMD 2025, ONS LSOA mid-year population estimates 2022 | ||||||||||
| IMD Decile by Area, Working aged population 18-66 | ||||||||||
| Area | 1 - Most deprived | 2 | 3 | 4 | 5 | 6 | 7 | 8 | 9 | 10 - Least deprived |
|---|---|---|---|---|---|---|---|---|---|---|
| Derby | 36979 (22.3%) | 30025 (18.1%) | 15680 (9.5%) | 11622 (7%) | 13978 (8.4%) | 12601 (7.6%) | 4744 (2.9%) | 10441 (6.3%) | 11167 (6.7%) | 18457 (11.1%) |
| Derbyshire | 26128 (5.3%) | 44687 (9.1%) | 50683 (10.3%) | 57095 (11.6%) | 56606 (11.5%) | 42434 (8.6%) | 63930 (13%) | 56582 (11.5%) | 50651 (10.3%) | 41910 (8.5%) |
| Amber Valley | 3162 (4.1%) | 7897 (10.2%) | 3333 (4.3%) | 11039 (14.3%) | 13350 (17.3%) | 3897 (5%) | 9381 (12.1%) | 11225 (14.5%) | 7126 (9.2%) | 6878 (8.9%) |
| Bolsover | 3042 (6%) | 9324 (18.3%) | 4568 (9%) | 13178 (25.8%) | 8659 (17%) | 2446 (4.8%) | 4906 (9.6%) | 3825 (7.5%) | 1079 (2.1%) | 0 |
| Chesterfield | 7589 (11.8%) | 8367 (13.1%) | 15811 (24.7%) | 7568 (11.8%) | 1475 (2.3%) | 6131 (9.6%) | 6867 (10.7%) | 1848 (2.9%) | 3003 (4.7%) | 5447 (8.5%) |
| Derbyshire Dales | 904 (2.2%) | 0 | 0 | 2784 (6.7%) | 4001 (9.6%) | 8243 (19.9%) | 9566 (23.1%) | 9599 (23.1%) | 5833 (14.1%) | 561 (1.4%) |
| Erewash | 5624 (8%) | 8186 (11.7%) | 8640 (12.3%) | 4140 (5.9%) | 7508 (10.7%) | 5624 (8%) | 7388 (10.5%) | 7383 (10.5%) | 10566 (15.1%) | 5026 (7.2%) |
| High Peak | 2532 (4.5%) | 2737 (4.9%) | 5019 (9%) | 4352 (7.8%) | 8253 (14.7%) | 6319 (11.3%) | 9204 (16.4%) | 10526 (18.8%) | 733 (1.3%) | 6289 (11.2%) |
| North East Derbyshire | 2373 (3.9%) | 5822 (9.5%) | 8525 (13.9%) | 6348 (10.3%) | 6827 (11.1%) | 6600 (10.7%) | 6637 (10.8%) | 3367 (5.5%) | 6814 (11.1%) | 8217 (13.4%) |
| South Derbyshire | 902 (1.3%) | 2354 (3.4%) | 4787 (6.9%) | 7686 (11.1%) | 6533 (9.4%) | 3174 (4.6%) | 9981 (14.4%) | 8809 (12.7%) | 15497 (22.4%) | 9492 (13.7%) |
| Source: Ministry of Housing, Communities and Local Government IMD 2025, ONS LSOA mid-year population estimates 2022 | ||||||||||
Indices of Deprivation
Health Indicators
Prevalence Maps of Derbyshire
The interactive map below shows the indices of deprivation for Derbyshire’s LSOAs. Read the guide below to found out how to use the interactive elements.
lower super output areas 2021
🗺️
How to Use This IMD 2025 Map
Layer Control: Use the  icon in the top right to switch between different workplace health indicators.
Places: Toggle place name labels on/off in the layer control.
Full Screen: Click the ⛶ button in the bottom left for full-screen viewing.
Area Details: Click on any area to see specific values and area names.
Please note: Areas in grey have no data available.
IOD Domain and Supplementary Indices Ranks
Below is a simple tool to compare the different domains and indices within the IoD25 across different districts within Derbyshire and Derby. The charts show the rank for each domain and how this compares to Derbyshire.
 Further Analysis & Assessments
Derbyshire Joint Strategic Needs Assessment (JSNA) involves a thorough examination of a specific health problem, exploring its causes, consequences, and underlying factors. It combines various data sources, collaboration with stakeholders, and rigorous analysis to generate insights for evidence-informed interventions and policy changes.
 More Information & Resources
Here is a list of useful resources and information related to deprivation. These materials are meant to provide individuals, healthcare professionals, and communities with the knowledge and tools they need as part of efforts to address deprivation as a population health topic.
Contributors
Catie Peach, Knowledge & Intelligence Officer, PHKIT
Chloe Hodson, Knowledge & Intelligence Officer, PHKIT
Claire Cooper, Knowledge & Intelligence Assistant, PHKIT
Dale Burton, Advanced Public Health Practitioner (Epidemiology), PHKIT
Footnotes
English indices of deprivation 2025: statistical release - GOV.UK↩︎
English indices of deprivation 2025: statistical release - GOV.UK↩︎
English indices of deprivation 2025: frequently asked questions - GOV.UK↩︎
NHS England » Core20PLUS5 (adults) – an approach to reducing healthcare inequalities↩︎
Derbyshire County Council, Policy, Index of Multiple Deprivation 2025 Dashboard↩︎
English indices of deprivation 2025: rural report - GOV.UK↩︎