Chapter 2: Setting the Scene
 Chapter 2: Setting the Scene
Between 2021 and 2023, 4,038 people in Derbyshire under 75 years old died of causes that were preventable.1 This included heart disease, cancers and respiratory disease and liver disease. Those in the most deprived areas were four times more likely to die of diseases which were preventable. Factors such as smoking and alcohol use, low physical activity and poor nutrition contribute to this.
For example, in 2021/22, 30.3% of adults aged 18+ years were classified as obese in Derbyshire and 25.9% in England.2 This increases the risk of chronic diseases, including cardiovascular disease, type 2 diabetes, cancer, liver and respiratory disease, and poor mental health. Also, 14% of adults aged 18+ smoked. The rates of smoking were higher among those in more deprived areas, those in routine and manual occupations, those who were unemployed and those with a severe mental illness.3 Smoking is the biggest single cause of preventable ill health and premature mortality in the UK and a major risk factor for cancers, respiratory disease and heart disease.
So, what has this got to do with the reports theme of work and health? Read on to find out more.
 why we need to talk about work and health - now
In 2023, about 8.2 million people in Britain aged 16-64 had long-term health conditions that made it difficult for them to work. This is about 20% of all working-age adults and is up from 15% in 2013.4
Between 2022 and 2023, 320,000 people had to leave their jobs because of health issues. This was an increase from the average of 260,000 per year between 2014 and 2019. Most of these people were employees. The rest either were self-employed or had other types of jobs.5
High economic inactivity is a legacy of the COVID-19 pandemic. Figure 3 below illustrates the change in economic inactivity and unemployment that occurred in the UK during and after the COVID-19 pandemic. The number of people who were economically inactive, shown in yellow in the graph, increased during the pandemic and has stayed at the same level since.
Figure 3: Change in economic inactivity, unemployment and employment since Dec-Feb 2020 for adults aged 16-64: UK6
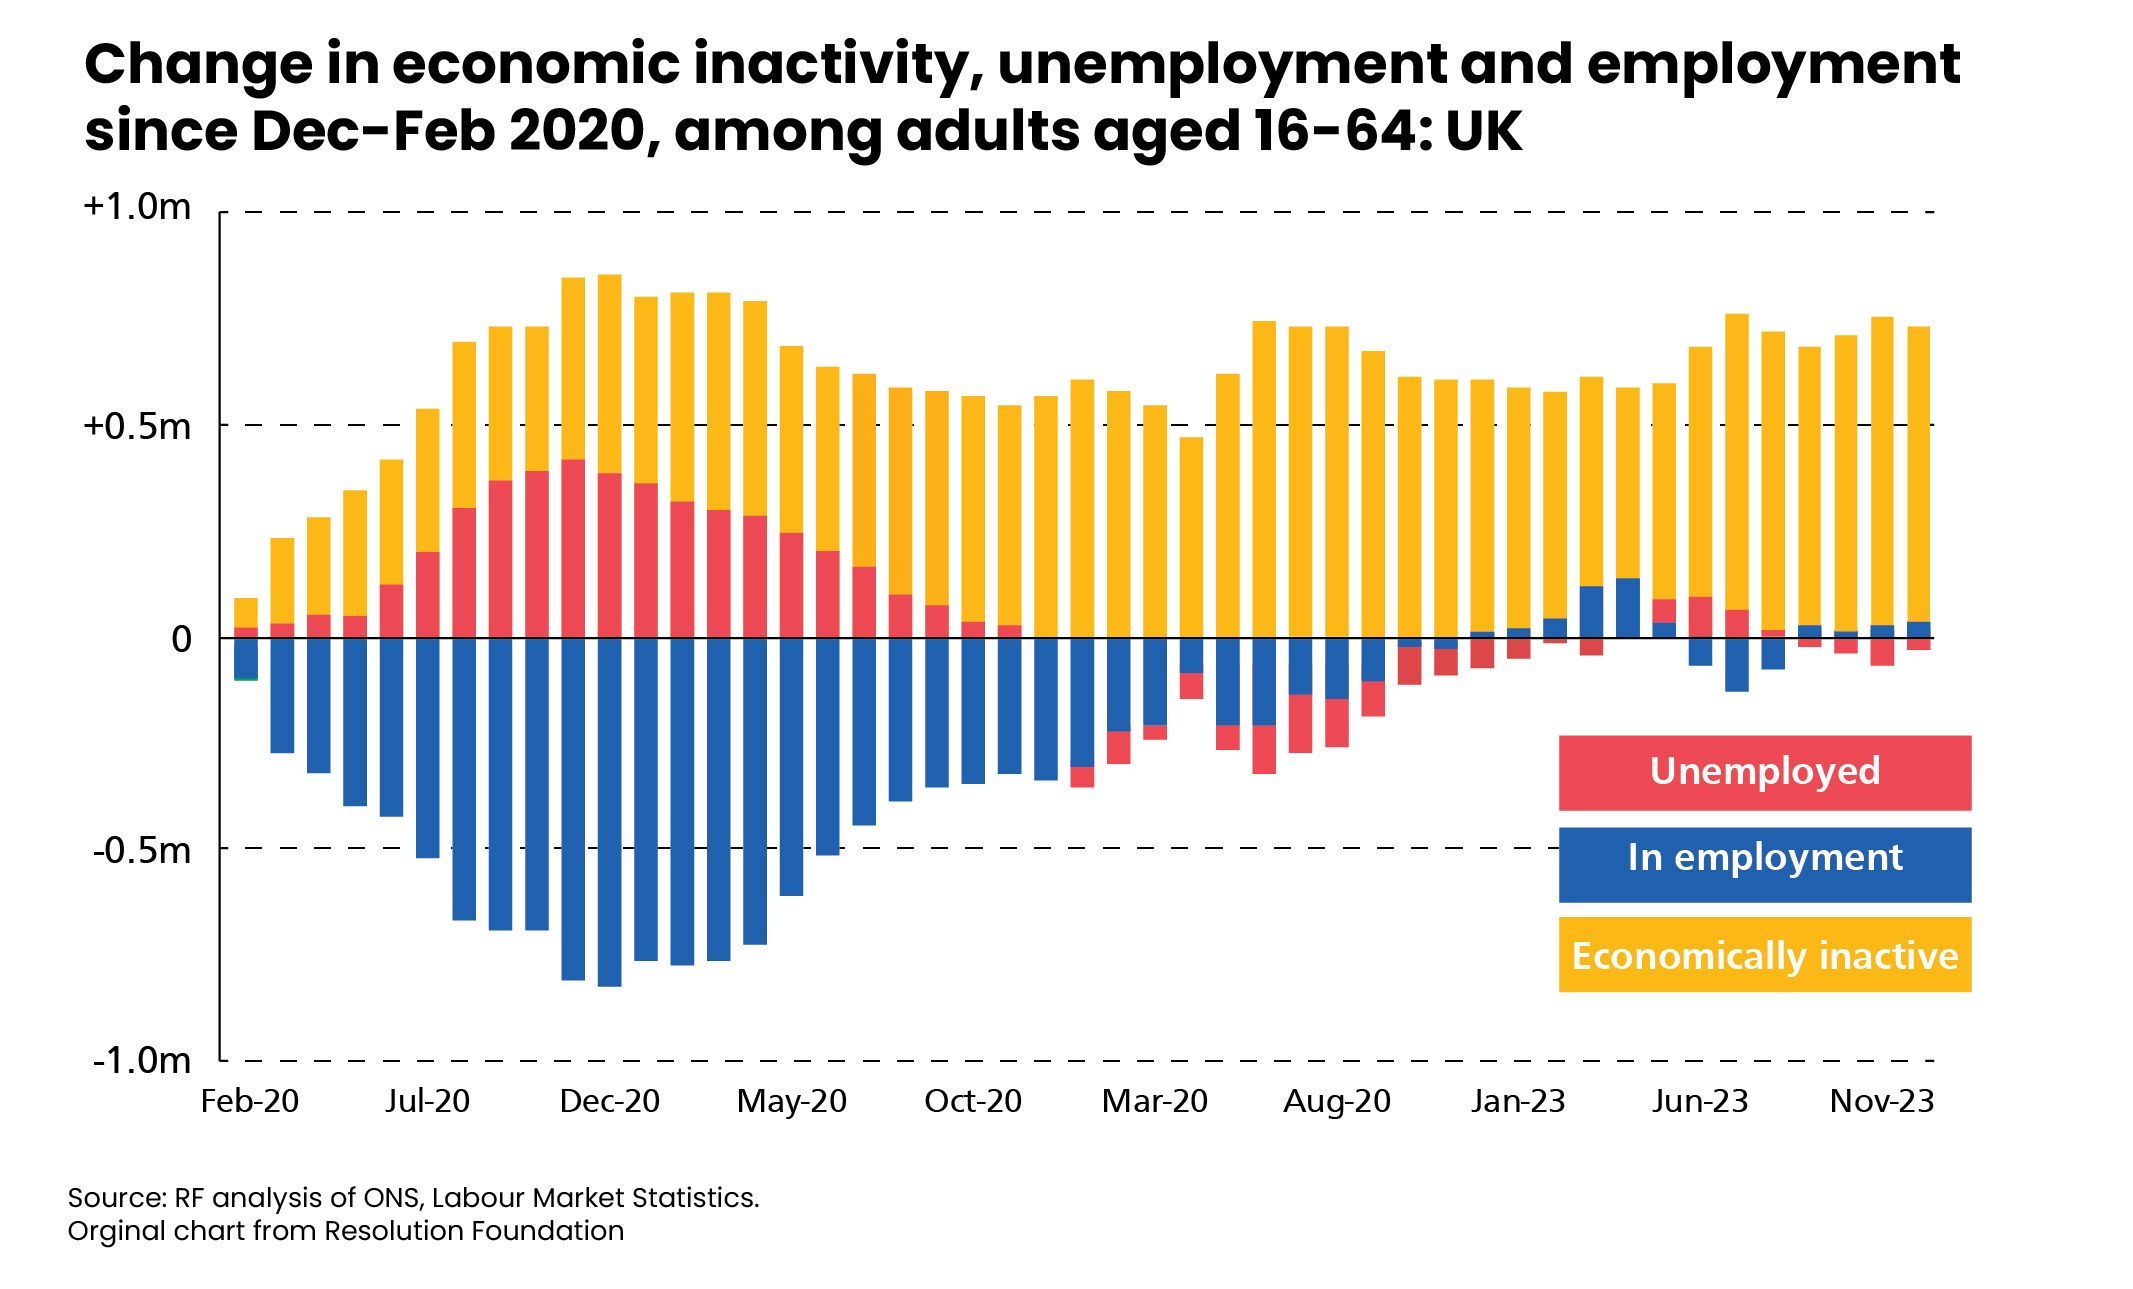
Britain is still recovering from the COVID-19 pandemic and employment has changed at a slower pace than many other high-income countries. Among G7 nations, the UK was the only country that did not see more adults rejoining the workforce after the pandemic.7
 the complexity of working age ill health is increasing
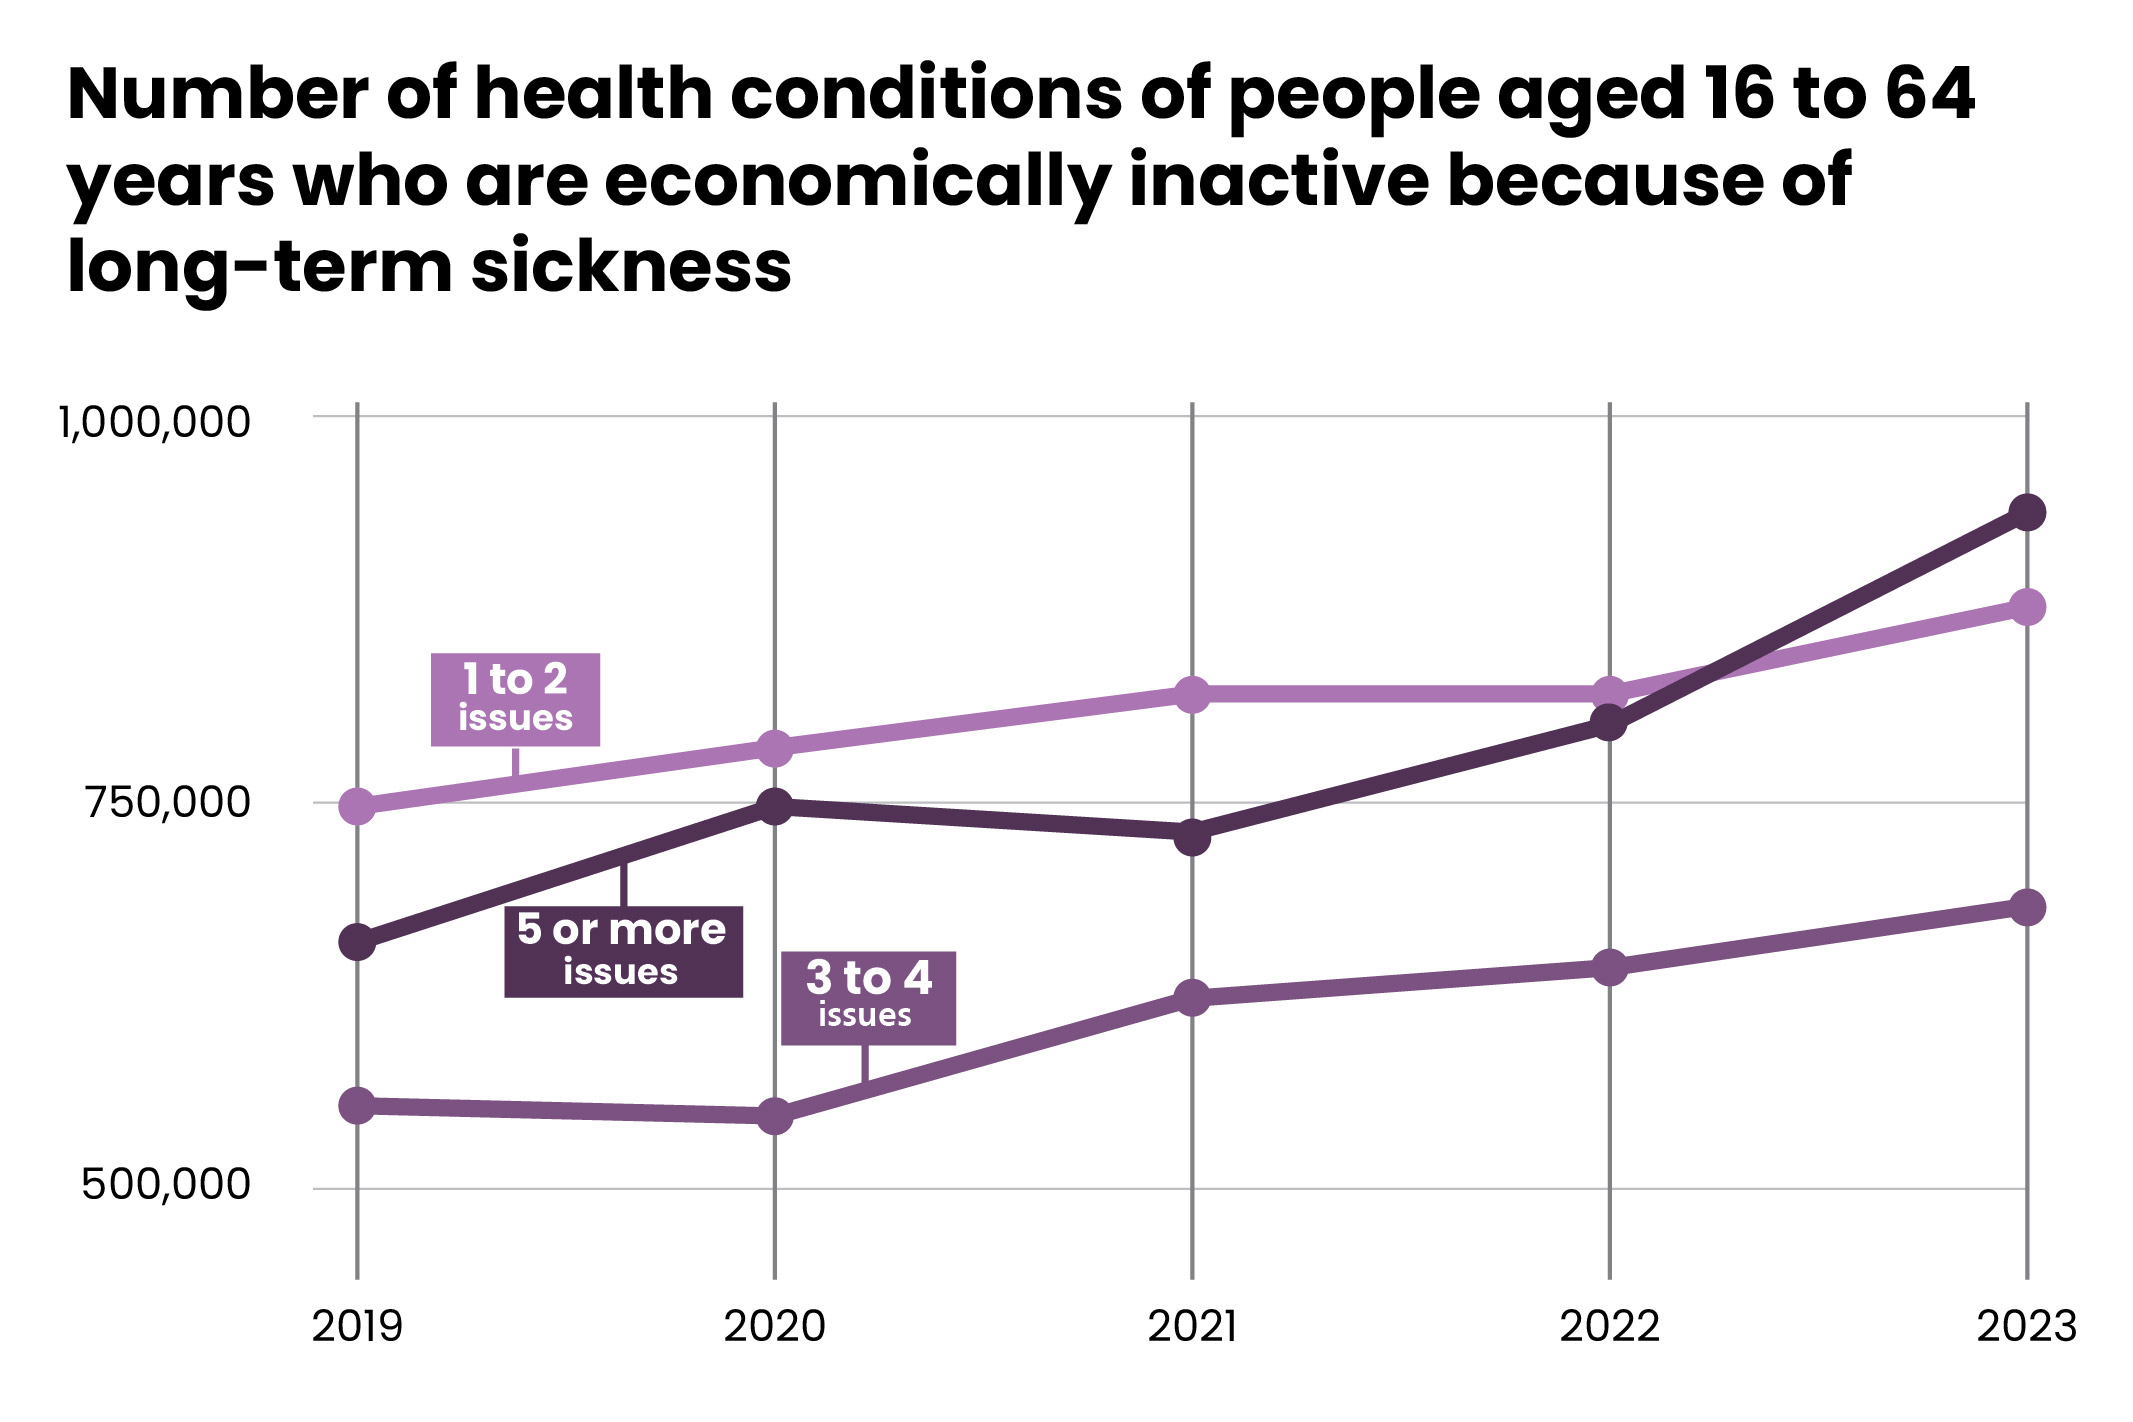
People with more than one health condition are more likely to leave work due to long-term sickness. 60% of those whose health limited their ability to work had more than one major health issue. The number of people with five or more conditions who are economically inactive due to long term sickness has increased since the COVID-19 pandemic, as illustrated by Figure 4 below.8
Figure 4: Number of health conditions of people aged 16 to 64 years who are economically inactive because of long-term sickness, UK, January to March 2019 to January to March 20239
In the 2021 census, one in five Derbyshire residents (20.1%) reported having a disability that placed some level of limitation on their day-to-day activities. This was significantly higher than national rate of 17.3%. These conditions include mental ill-health, musculoskeletal conditions, cardiovascular conditions, respiratory conditions and diabetes, most of which are preventable.10
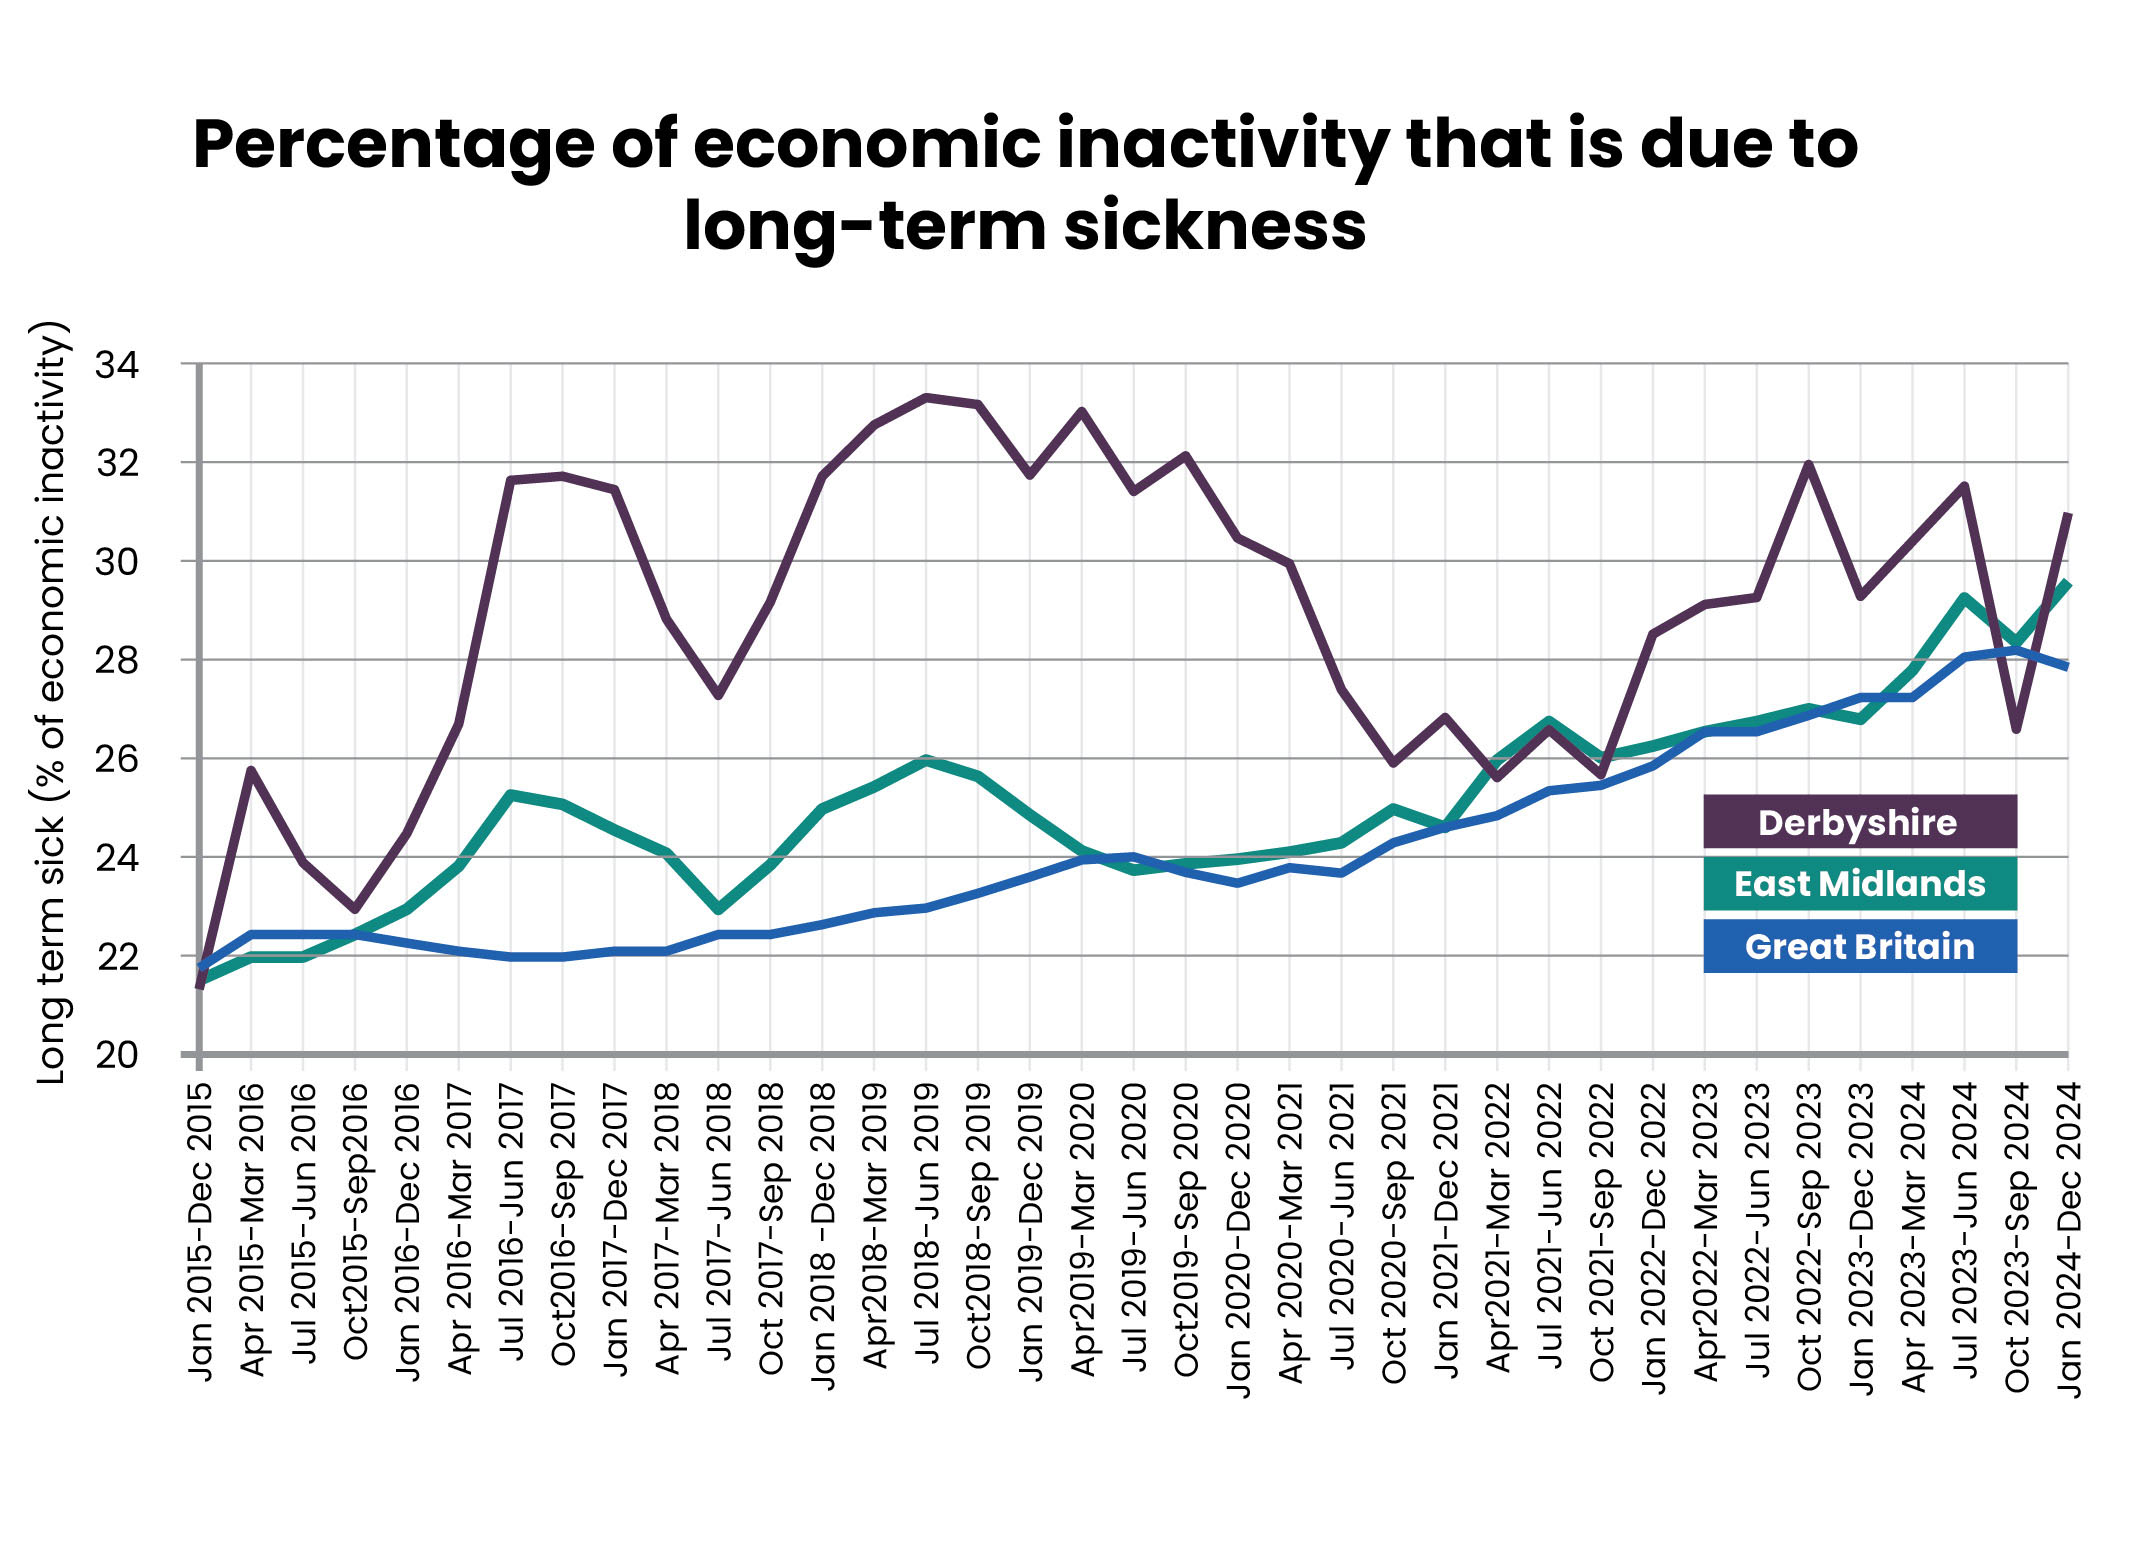
In 2025, 19.1% of Derbyshire’s working-age population was economically inactive, which was similar to the East Midlands region and the national situation. However, as figure 5 below shows, the proportion who were inactive due to long term sickness consistently exceeded regional and national averages .11
Figure 5: the proportion of economic inactivity that is due to long-term health conditions (January 2015 to December 2024)12
 the burden falls unequally
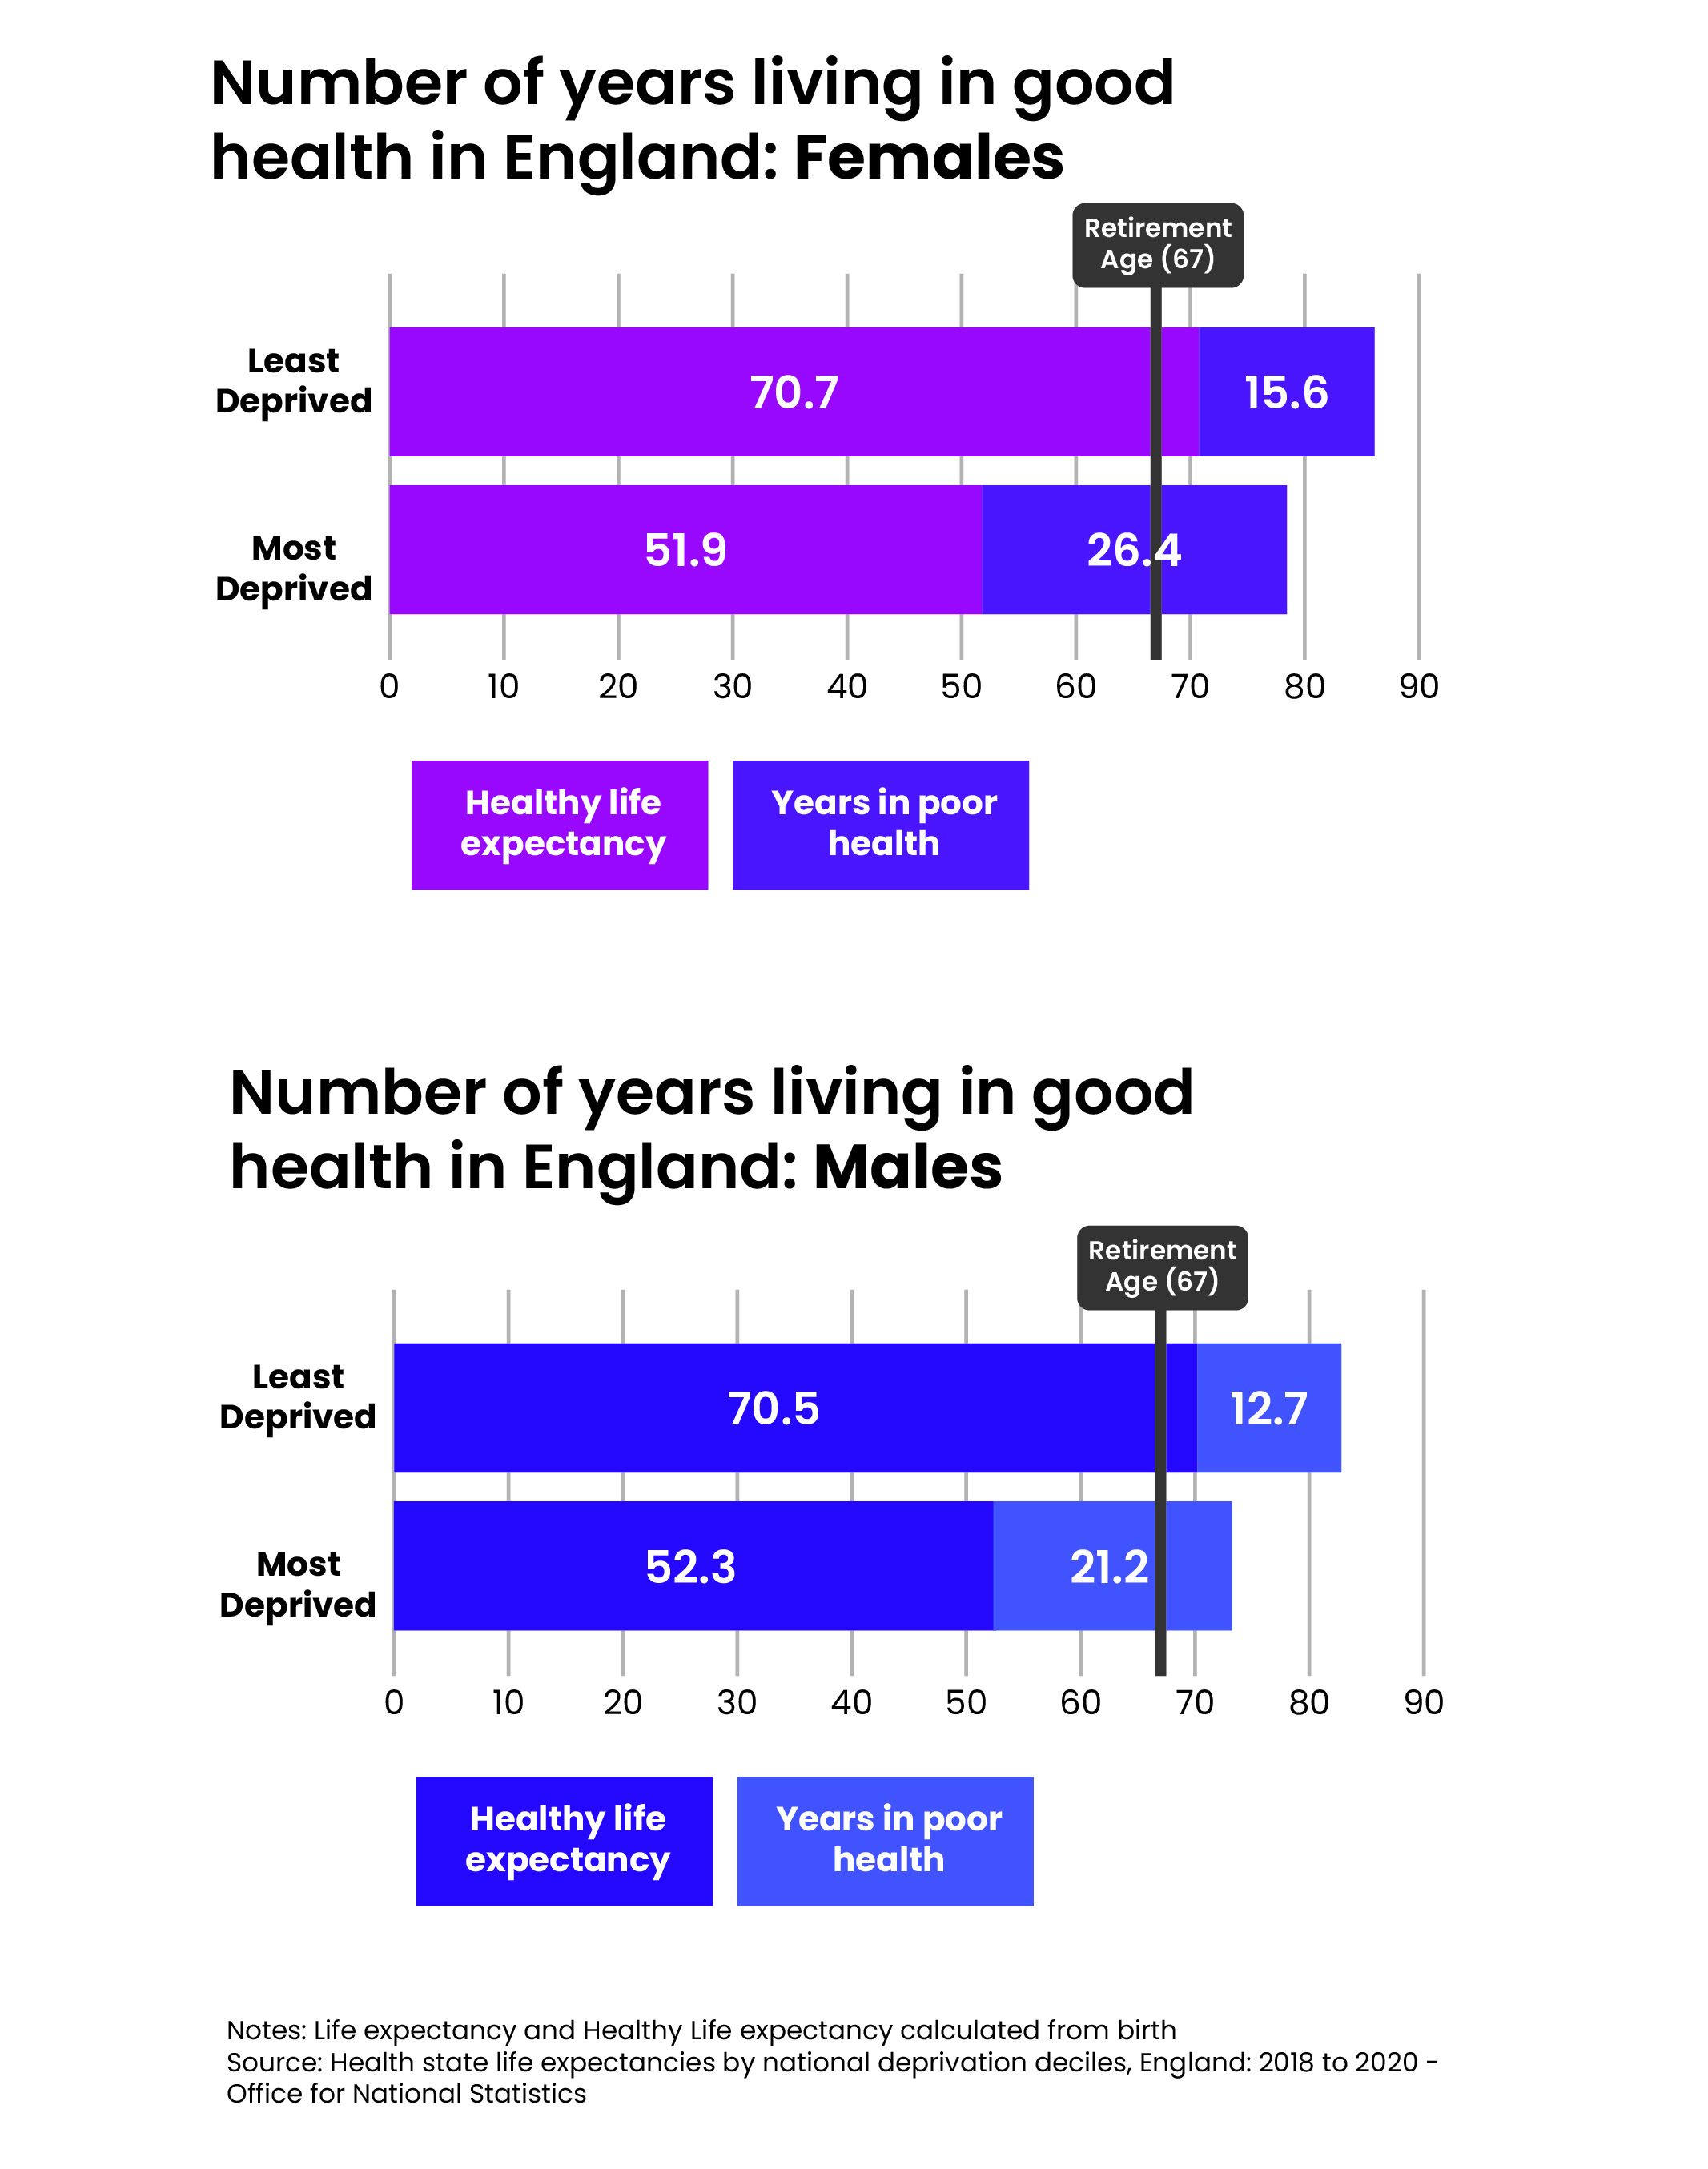
Life expectancy and healthy life expectancy between different communities in Derbyshire are not equal. In the most prosperous communities, people are likely to reach retirement before major health issues develop and to live longer. In the poorest communities, however, people are likely to develop major health conditions 15 years before state retirement age and to die earlier, as illustrated in Figure 6 below. Most of this gap in life expectancy between communities is driven by social and economic inequalities, such as access to employment, education, housing and nutrition.
Figure 6: the gap between life expectancy and healthy life expectancy for men and women in England13
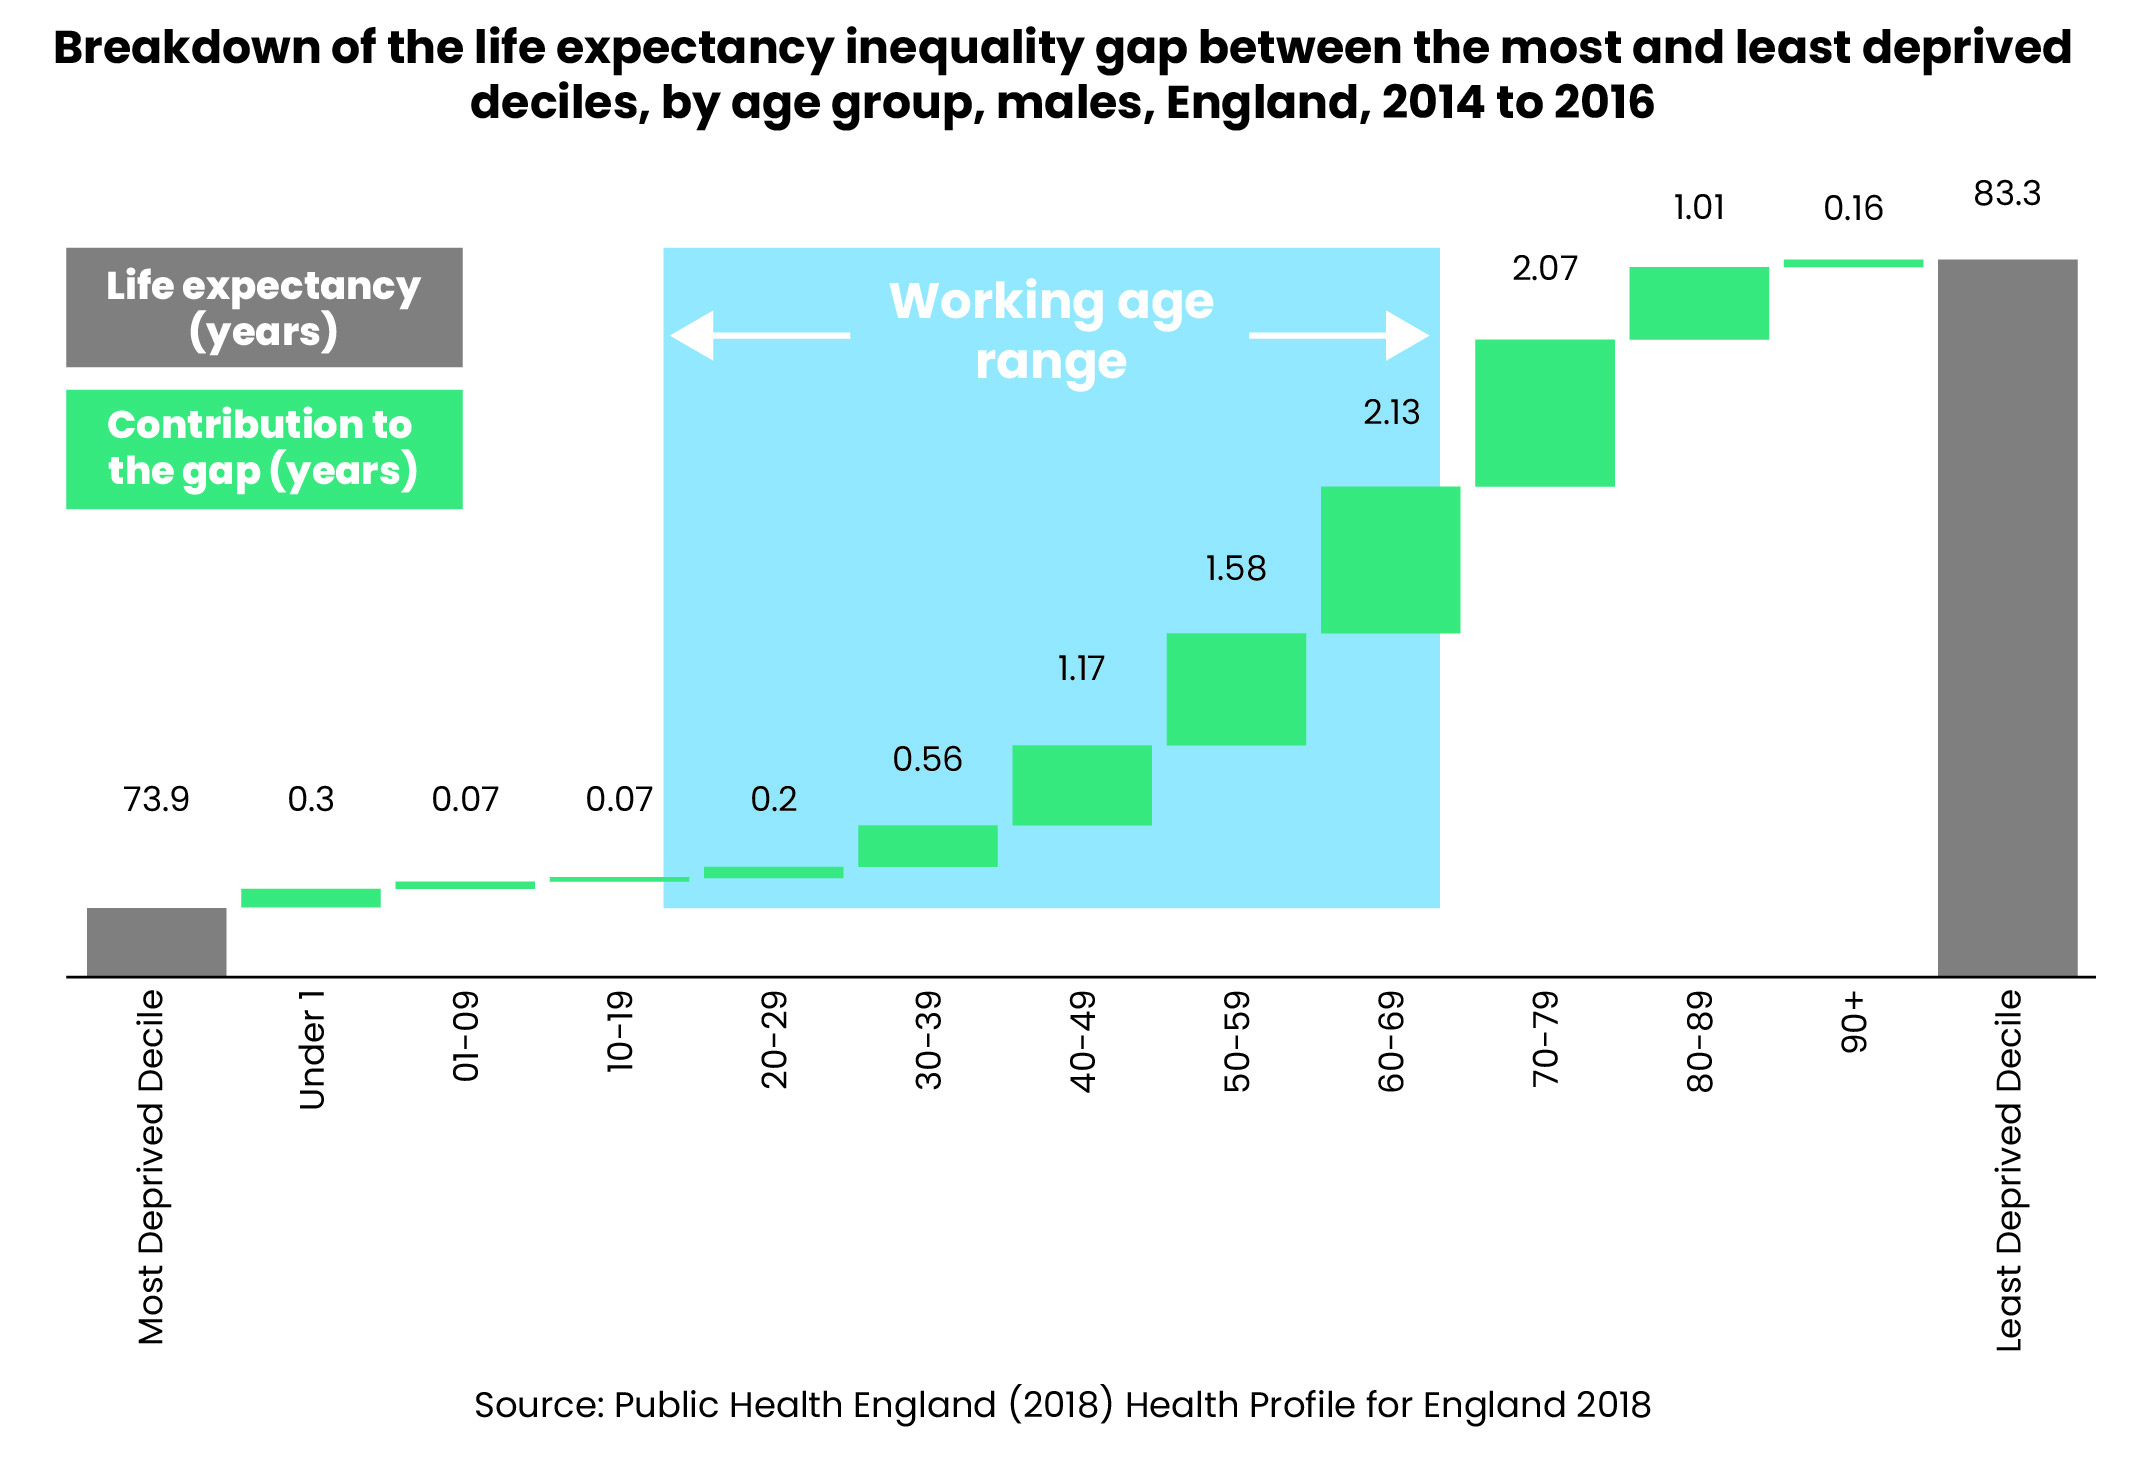
Working age is the stage of life when poor health emerges, and the gap widens between those who are most deprived and those who are least deprived, as illustrated in Figure 7 below.
Figure 7 - Breakdown of the life expectancy inequality gap between the most and least deprived deciles, by age group, males, England, 2014 to 201614
Economic inactivity due to long-term sickness reinforces and widens the inequalities in health between communities. The poorest communities are hit the hardest. Figure 8 below illustrates that the highest rates occur in the areas of Derbyshire, which already have the poorest health outcomes. The red areas on the map show the areas of Derbyshire where the rates of economic inactivity due to long term sickness are greatest. These are the same areas, where life expectancy from birth is lowest and where more people live in poverty. To view each indicator click on the icon in the top right corner of the map.
Figure 8: How economic inactivity maps to life expectancy and deprivation in Derbyshire15,16,17
middle super output areas 2021
🗺️
How to Use This Map
Layer Control: Use the  icon in the top right to switch between different workplace health indicators.
Places: Toggle place name labels on/off in the layer control.
Full Screen: Click the ⛶ button in the bottom left for full-screen viewing.
Area Details: Click on any area to see specific values and area names.
Please note: Areas in grey have no data available.
 age is a factor, but not the only factor
As people get older, the risk of poor health, which limits their ability to work increases. In 2022, 54% of working aged people in the UK who were economically inactive due to long-term sickness were aged 50 or older.18
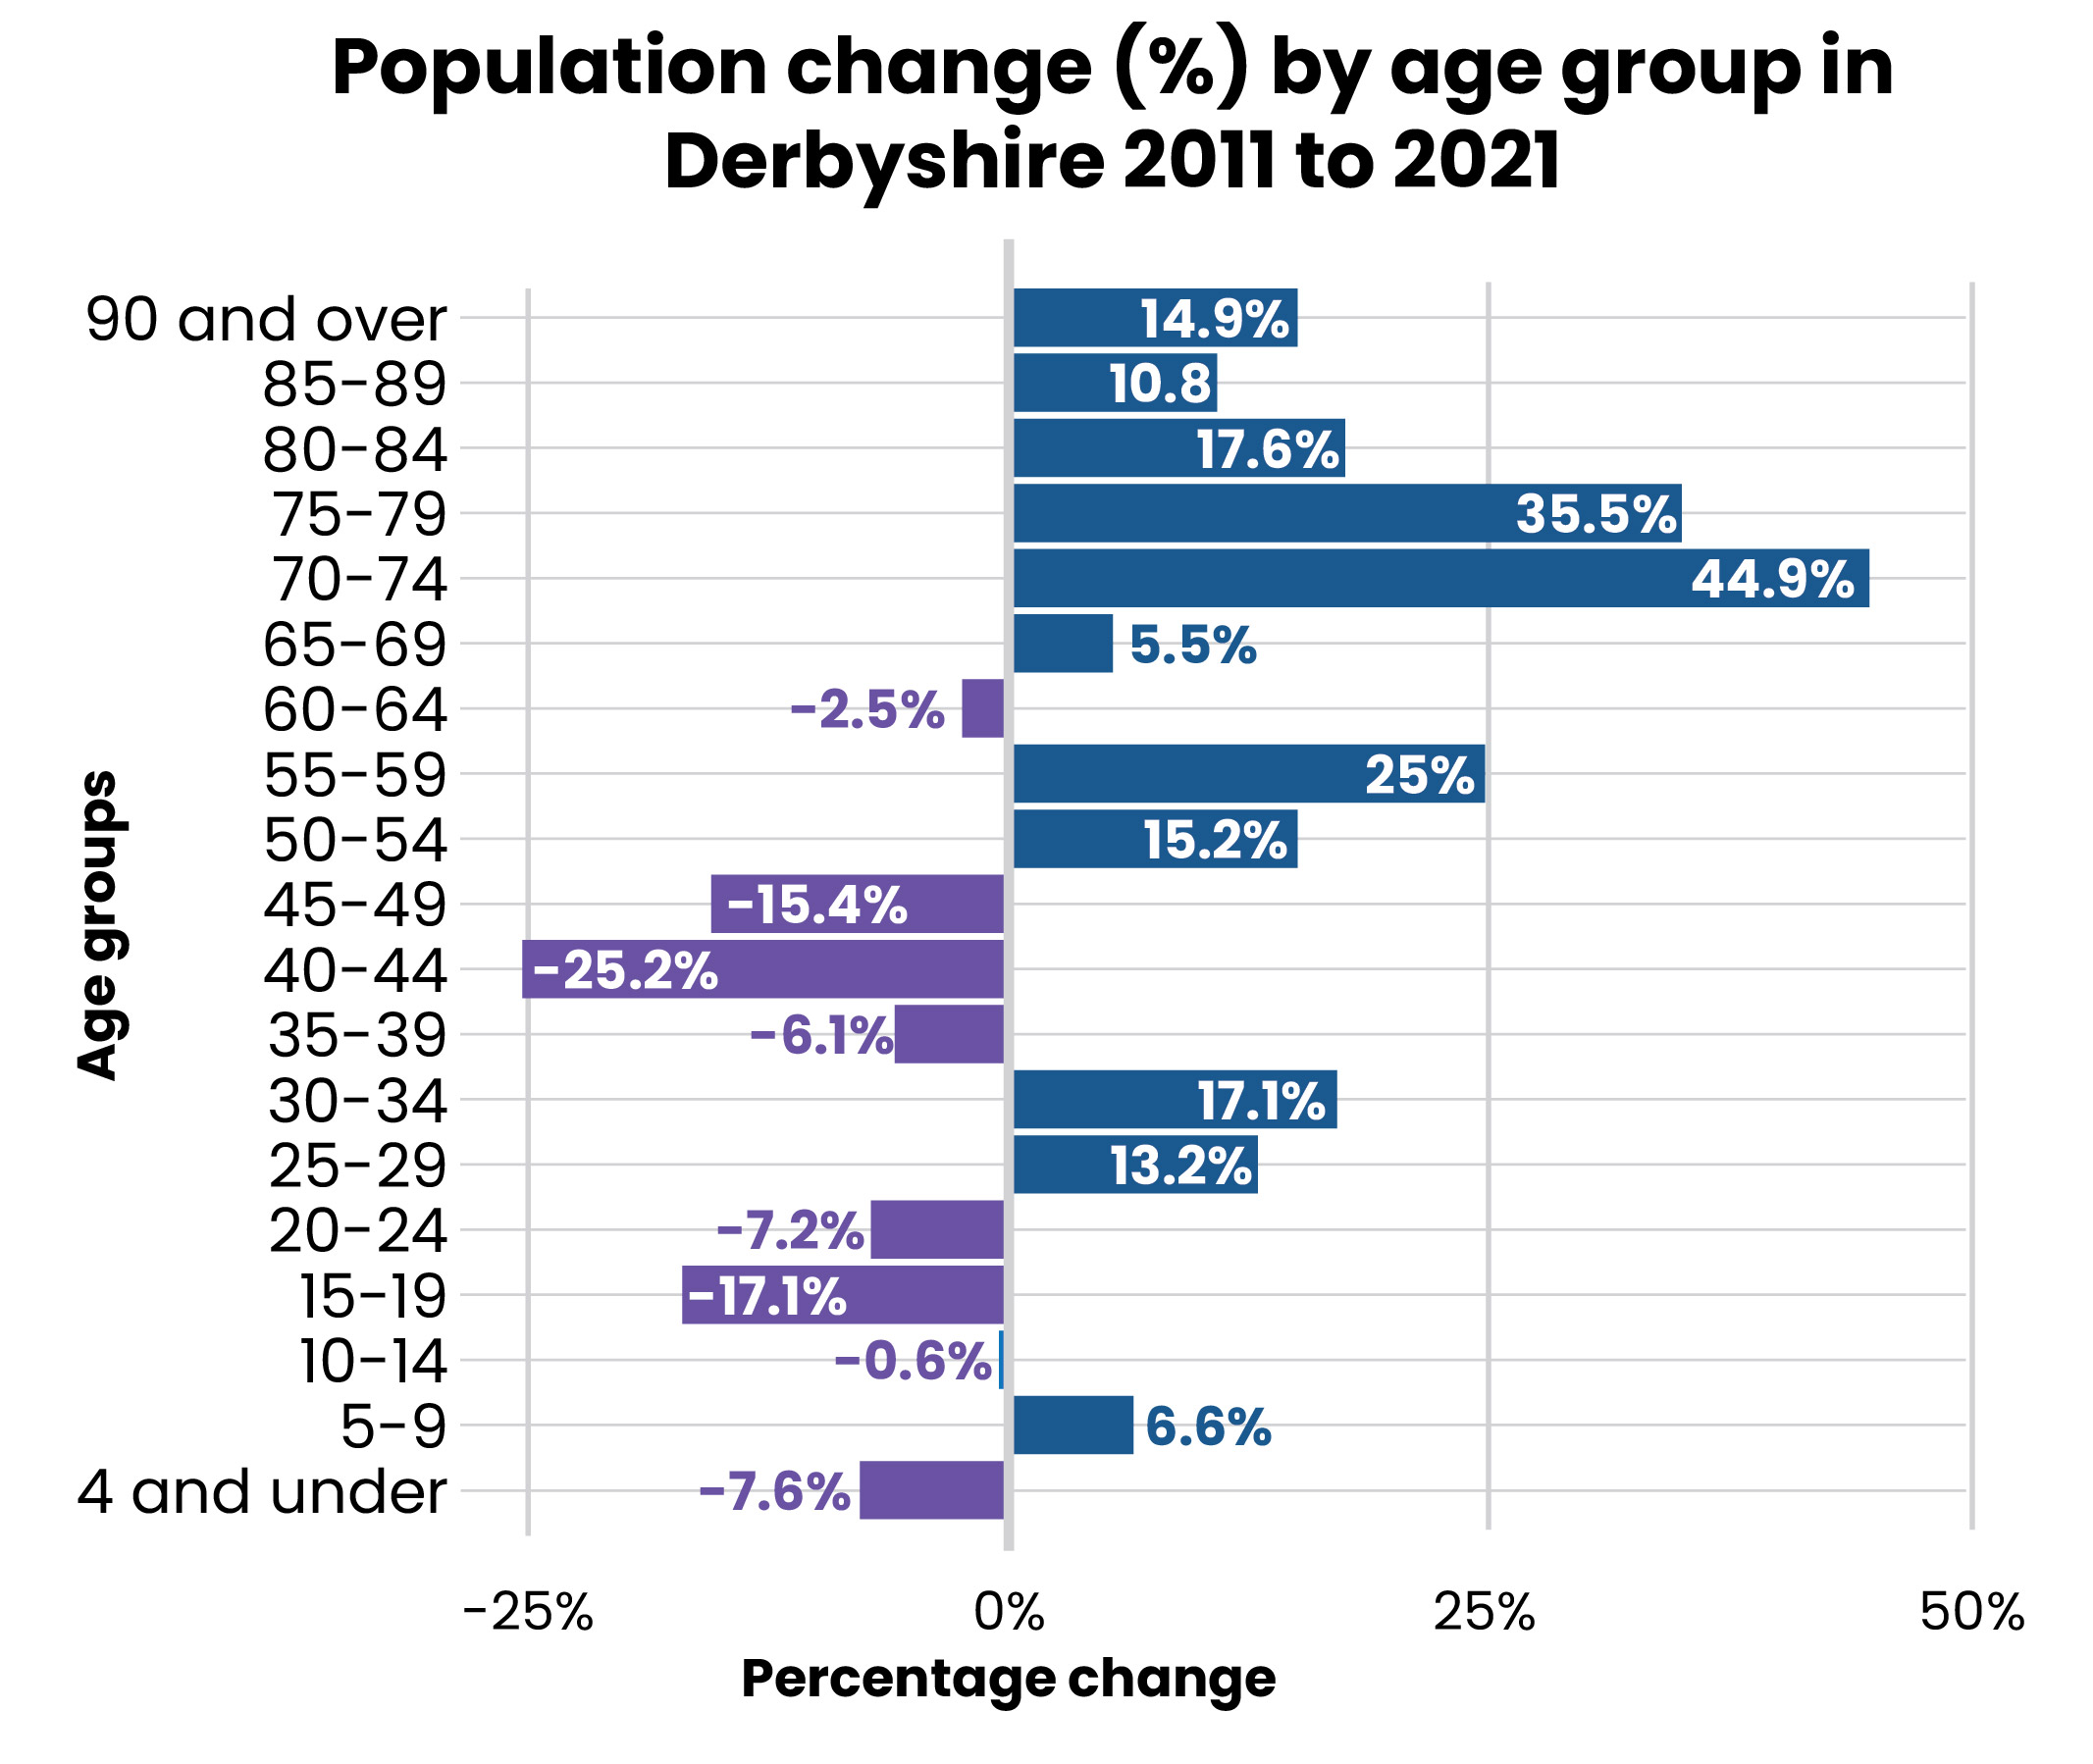
Derbyshire’s population is older than the national average. Figure 9 below shows that proportion of the working age population aged 50 and above has increased sharply between the 2011 and 2021 census.19 This influences the number of people locally that leave work due to ill health.
Figure 9: Population change (percentage) by age group in Derbyshire (2011 to 2021)20
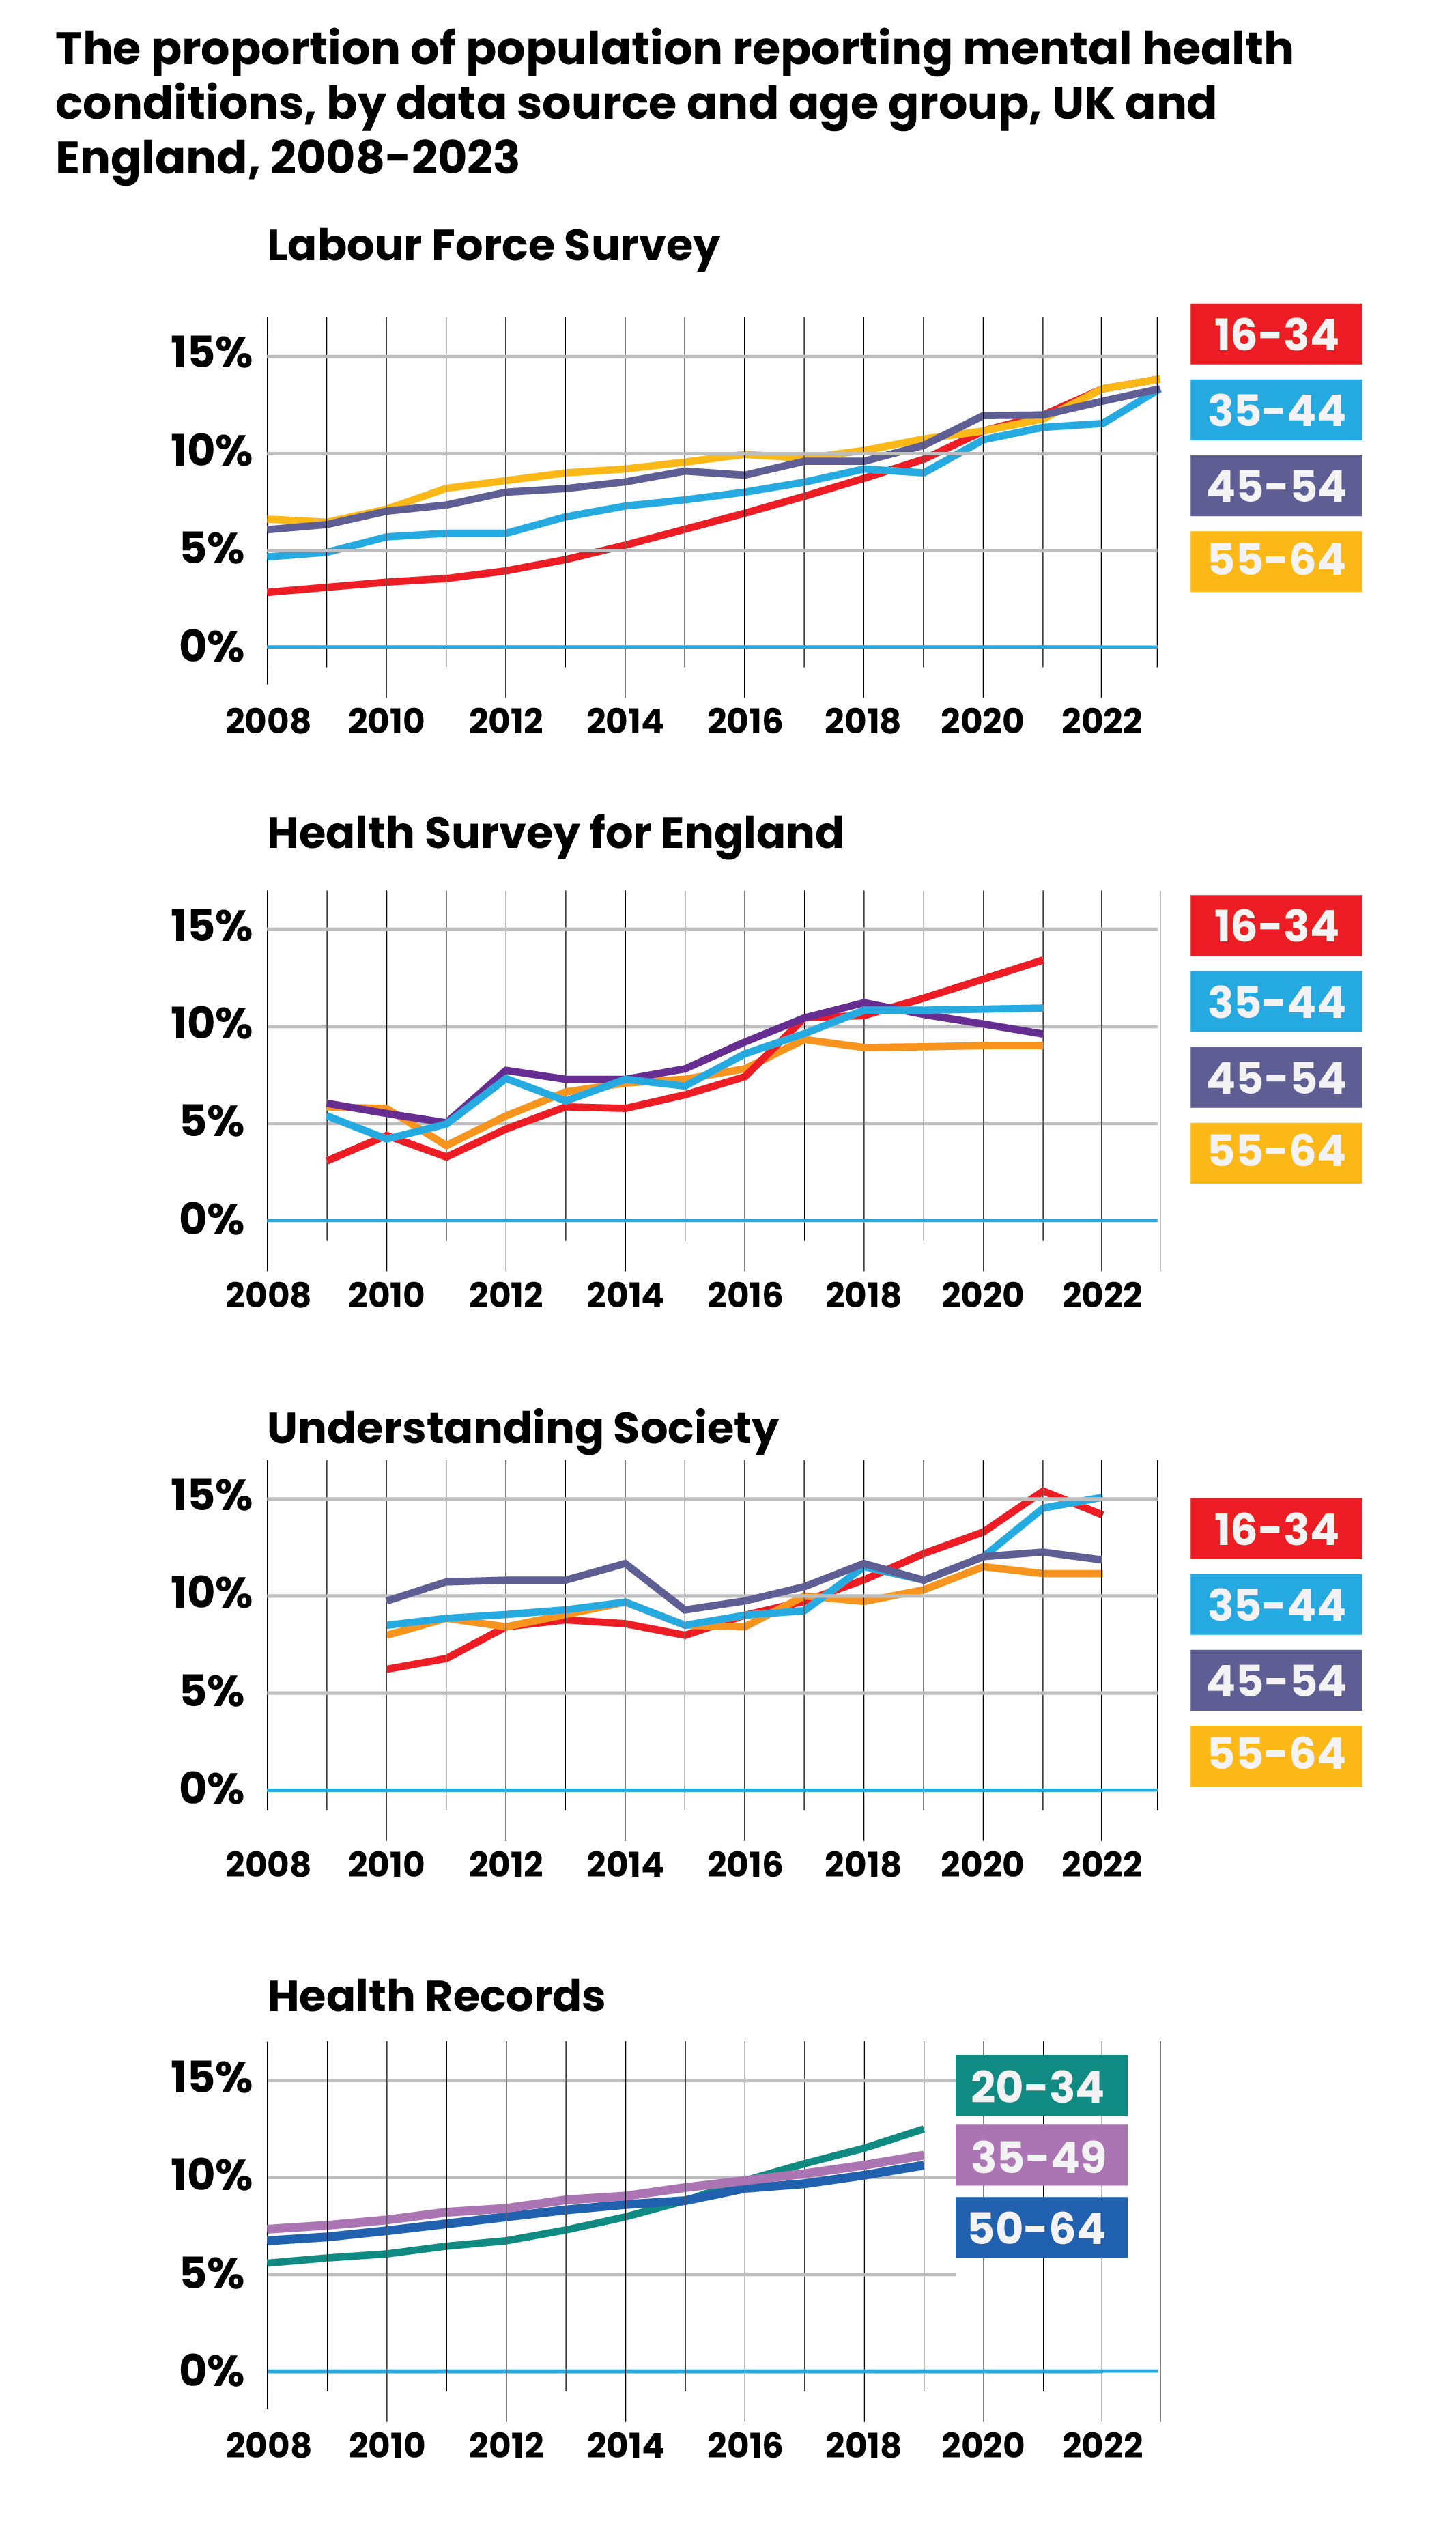
Age is not the only factor behind rises economic inactivity due to long-term sickness. The proportion of working aged adults with poor mental health has doubled since 2010, as shown in Figure 10 below. Of note is the sharp increase in number of young adults with mental health conditions.21
Figure 10. The proportion of population reporting mental health conditions, by data source and age group, UK and England, 2008-202322
 certain groups face additional barriers to work
Certain groups of people struggle to stay in work or to enter the workforce in the first place and face major barriers when trying to do so. The groups who are adversely impacted include people with disabilities, neurodiversity, mental illness, long-term health conditions, or caring responsibilities. These groups are also at risk of poorer health outcomes.
For example, the life expectancy for adults with a learning disability is 12 years less than the general population and more likely to have a long-term health condition such as type 2 diabetes.23 However, only 5% of working aged adults with a learning disability are in employment.24
 young people with no qualifications are at risk
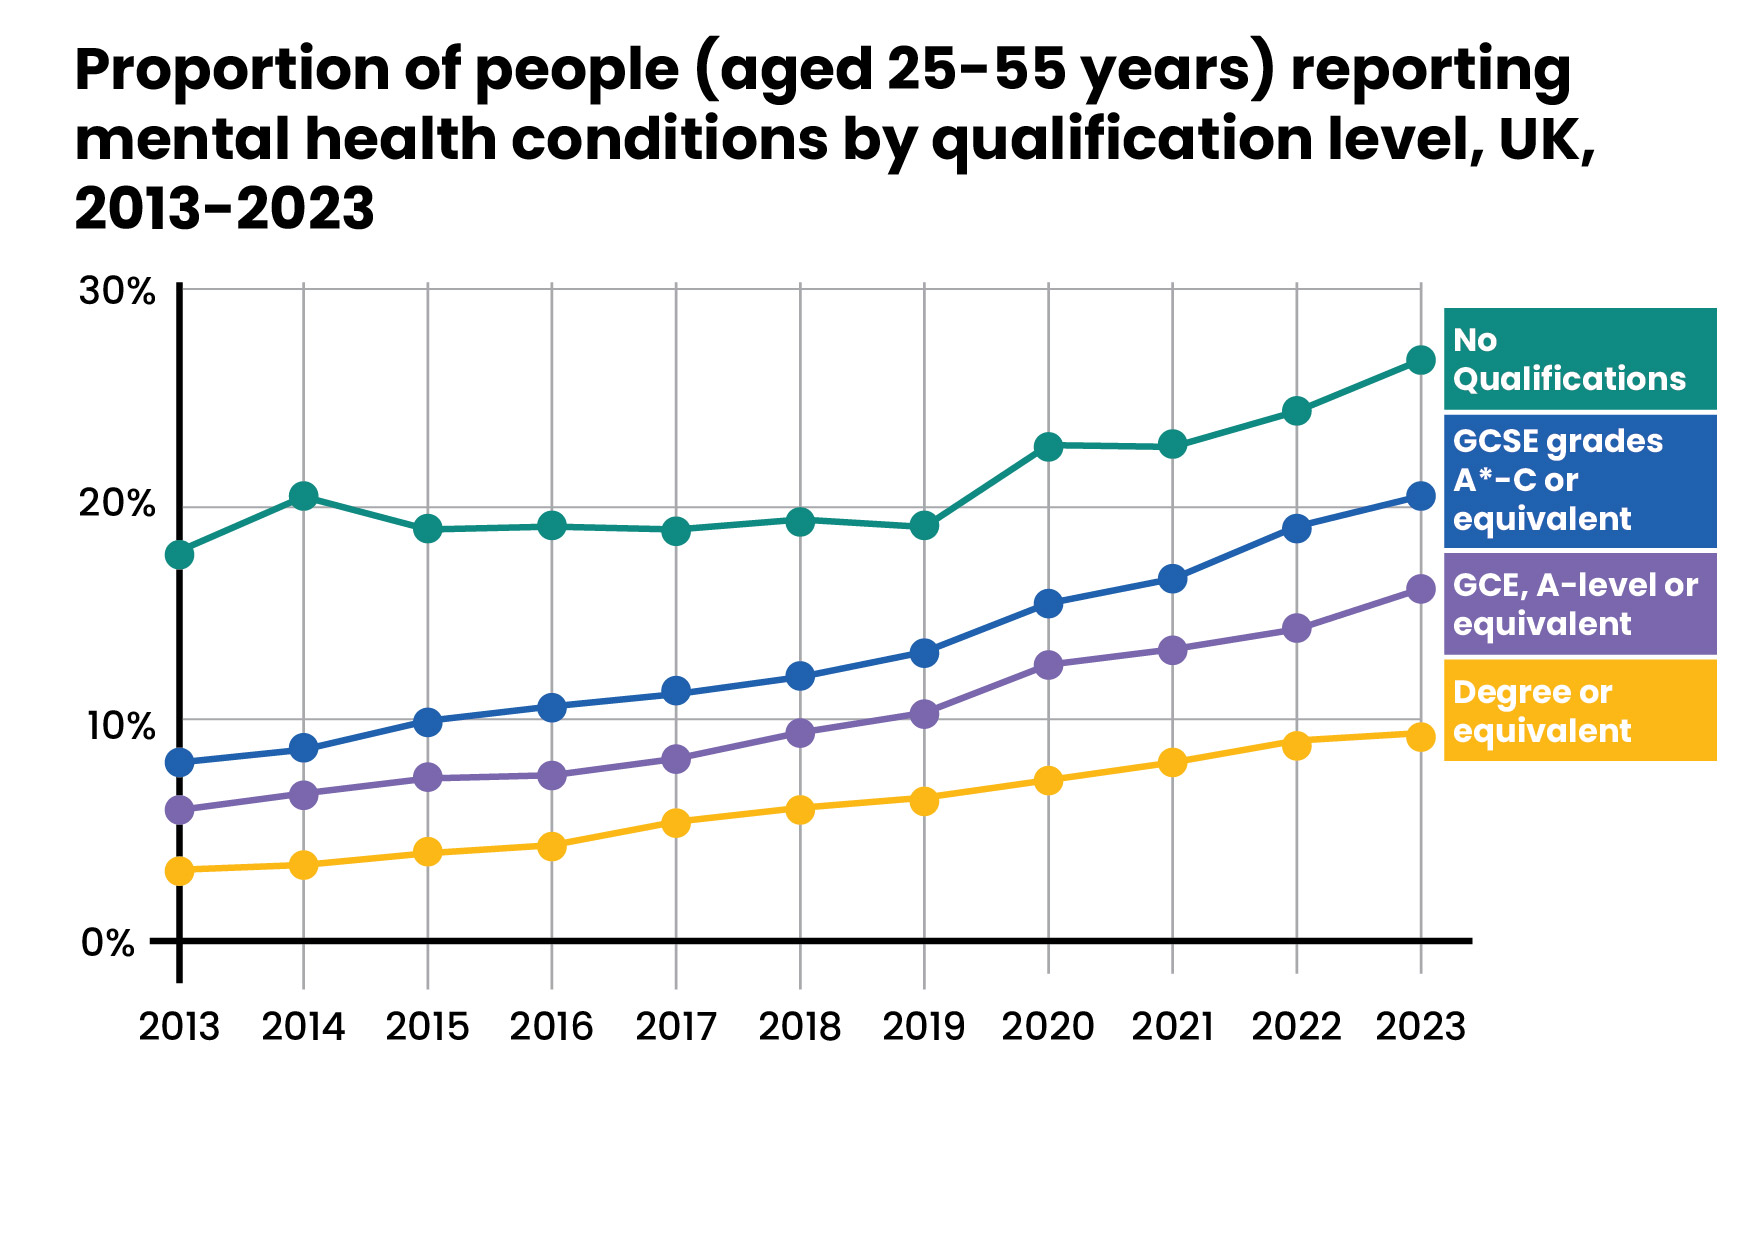
Mental health issues are a growing barrier to employment for under-25s. Early unemployment can have lifelong health and economic consequences. Access to good quality education and training are vital to ensuring good long term health outcomes for young people who are entering adulthood. Figure 11 below shows that people who have no qualifications are more likely to experience mental ill health in later life.
Figure 11: Proportion of people (aged 25-55 years) reporting mental health conditions by qualification level, UK, 2013-202325
 the cost of inaction is enormous: doing nothing is not an option
When people are unable to work because of ill health, it also impacts their families, their communities, their employers, and the wider economy.
In 2022, working age ill health cost the UK economy £259 billion in 2022 with a loss of £57 billion to the exchequer in lost tax and NI contributions. Table 2 below shows the breakdown of costs. This was a real terms increase of 74% to 83% since 2016 from an estimated £114-149 billion in 2016 (£138 to £180 billion in 2022 prices).26 Public spending on incapacity benefits is expected to rise in real terms (2024/25) from £20.9 billion a year in 2019/20 to £32.1 billion by 2029/30.27
Table 2: Cost of working age ill health and disability that prevented work in 2022 (Billions)28
| Cost Element | Description | Cost (£ billion) |
|---|---|---|
| Economic Inactivity | Lost output due to working-age ill-health which prevents work | 132 |
| Sickness absence | Lost output due to sickness absence | 47 |
| Informal care giving | Lost output due to working age carers caring for working age sick | 37 |
| NHS cost | The additional costs to the NHS when someone with a health problem is economically inactive rather than economically active | 2 |
| Benefits payments | Cost of social security benefits related to health conditions that prevent people from working | 41 |
| Total | Total expenditure in 2022 | 259 |
| of which: Exchequer flowbacks | Tax and National Insurance foregone due to health-related worklessness | 57 |
The situation, that the report has described so far is detrimental to the health and wealth of communities in Derbyshire. In the chapters that follow, the report will explore the opportunities for action. It will look at why work is good for health, how employers and other partners can overcome some of the barriers to accessing employment and why health is a good investment for businesses and employers.
Although the report has told the story in numbers so far, you can also hear the testimonies of local people and businesses from across Derbyshire by clicking below.
LISTENING TO DERBYSHIRE VOICES
Explore lived experiences from across Derbyshire. Discover how tailored support, persistence, and opportunity change lives.
Footnotes
Office for Health Improvement and Disparities (2025) Public health profiles. © Crown copyright 2025↩︎
Office for Health Improvement and Disparities (2025) Public health profiles. © Crown copyright 2025↩︎
Office for Health Improvement and Disparities (2025) Public health profiles. © Crown copyright 2025↩︎
Health Foundation/The Commission for Healthier working Lives (2025) Action for Healthier Working Lives: Final Report of the Commission for Healthier Working Lives↩︎
Health Foundation/The Commission for Healthier working Lives (2025) Action for Healthier Working Lives: Final Report of the Commission for Healthier Working Lives↩︎
Murphy L (2024) A U-Shaped legacy: taking stock of trends in economic inactivity in 2024, Resolution Foundation↩︎
Murphy L (2024) A U-Shaped legacy: taking stock of trends in economic inactivity in 2024, Resolution Foundation↩︎
ONS (2023) Rising ill-health and economic inactivity because of long-term sickness, UK: 2019 to 2023↩︎
ONS (2023) Rising ill-health and economic inactivity because of long-term sickness, UK: 2019 to 2023↩︎
Office of National Statistics (2022) Health state life expectancies by national deprivation deciles, England: 2018 to 2020↩︎
Public Health England (2018) Health Profile for England 2018↩︎
Derbyshire County Council (2025) Joint Strategic Needs Assessment – Population↩︎
Derbyshire County Council (2025) Joint Strategic Needs Assessment – Disability Employment↩︎
Derbyshire County Council (2019) Deprivation in Derbyshire 2019↩︎
Kirk-Wade E, Harker R (2023) How is health affecting economic inactivity, UK Government, House of Commons Library↩︎
Derbyshire County Council (2025) Joint Strategic Needs Assessment – Population↩︎
Derbyshire County Council (2025) Joint Strategic Needs Assessment – Population↩︎
Health Foundation/The Commission for Healthier working Lives (2025) Action for Healthier Working Lives: Final Report of the Commission for Healthier Working Lives↩︎
Health Foundation/The Commission for Healthier working Lives (2025) Action for Healthier Working Lives: Final Report of the Commission for Healthier Working Lives↩︎
NHS Digital (2020) Health and Care of People with Learning Disabilities, Experimental Statistics: 2018 to 2019↩︎
MENCAP (undated) How many adults with a learning disability have a paid job?↩︎
Vriend M, Rocks C, Finch D (2025) Mental health trends among working-age people, Health Foundation↩︎
Department for Work and Pensions (2025) The cost of working age ill-health and disability that prevents work↩︎
Health Foundation/The Commission for Healthier working Lives (2025) Action for Healthier Working Lives: Final Report of the Commission for Healthier Working Lives↩︎
Department for Work and Pensions (2025) The cost of working age ill-health and disability that prevents work↩︎